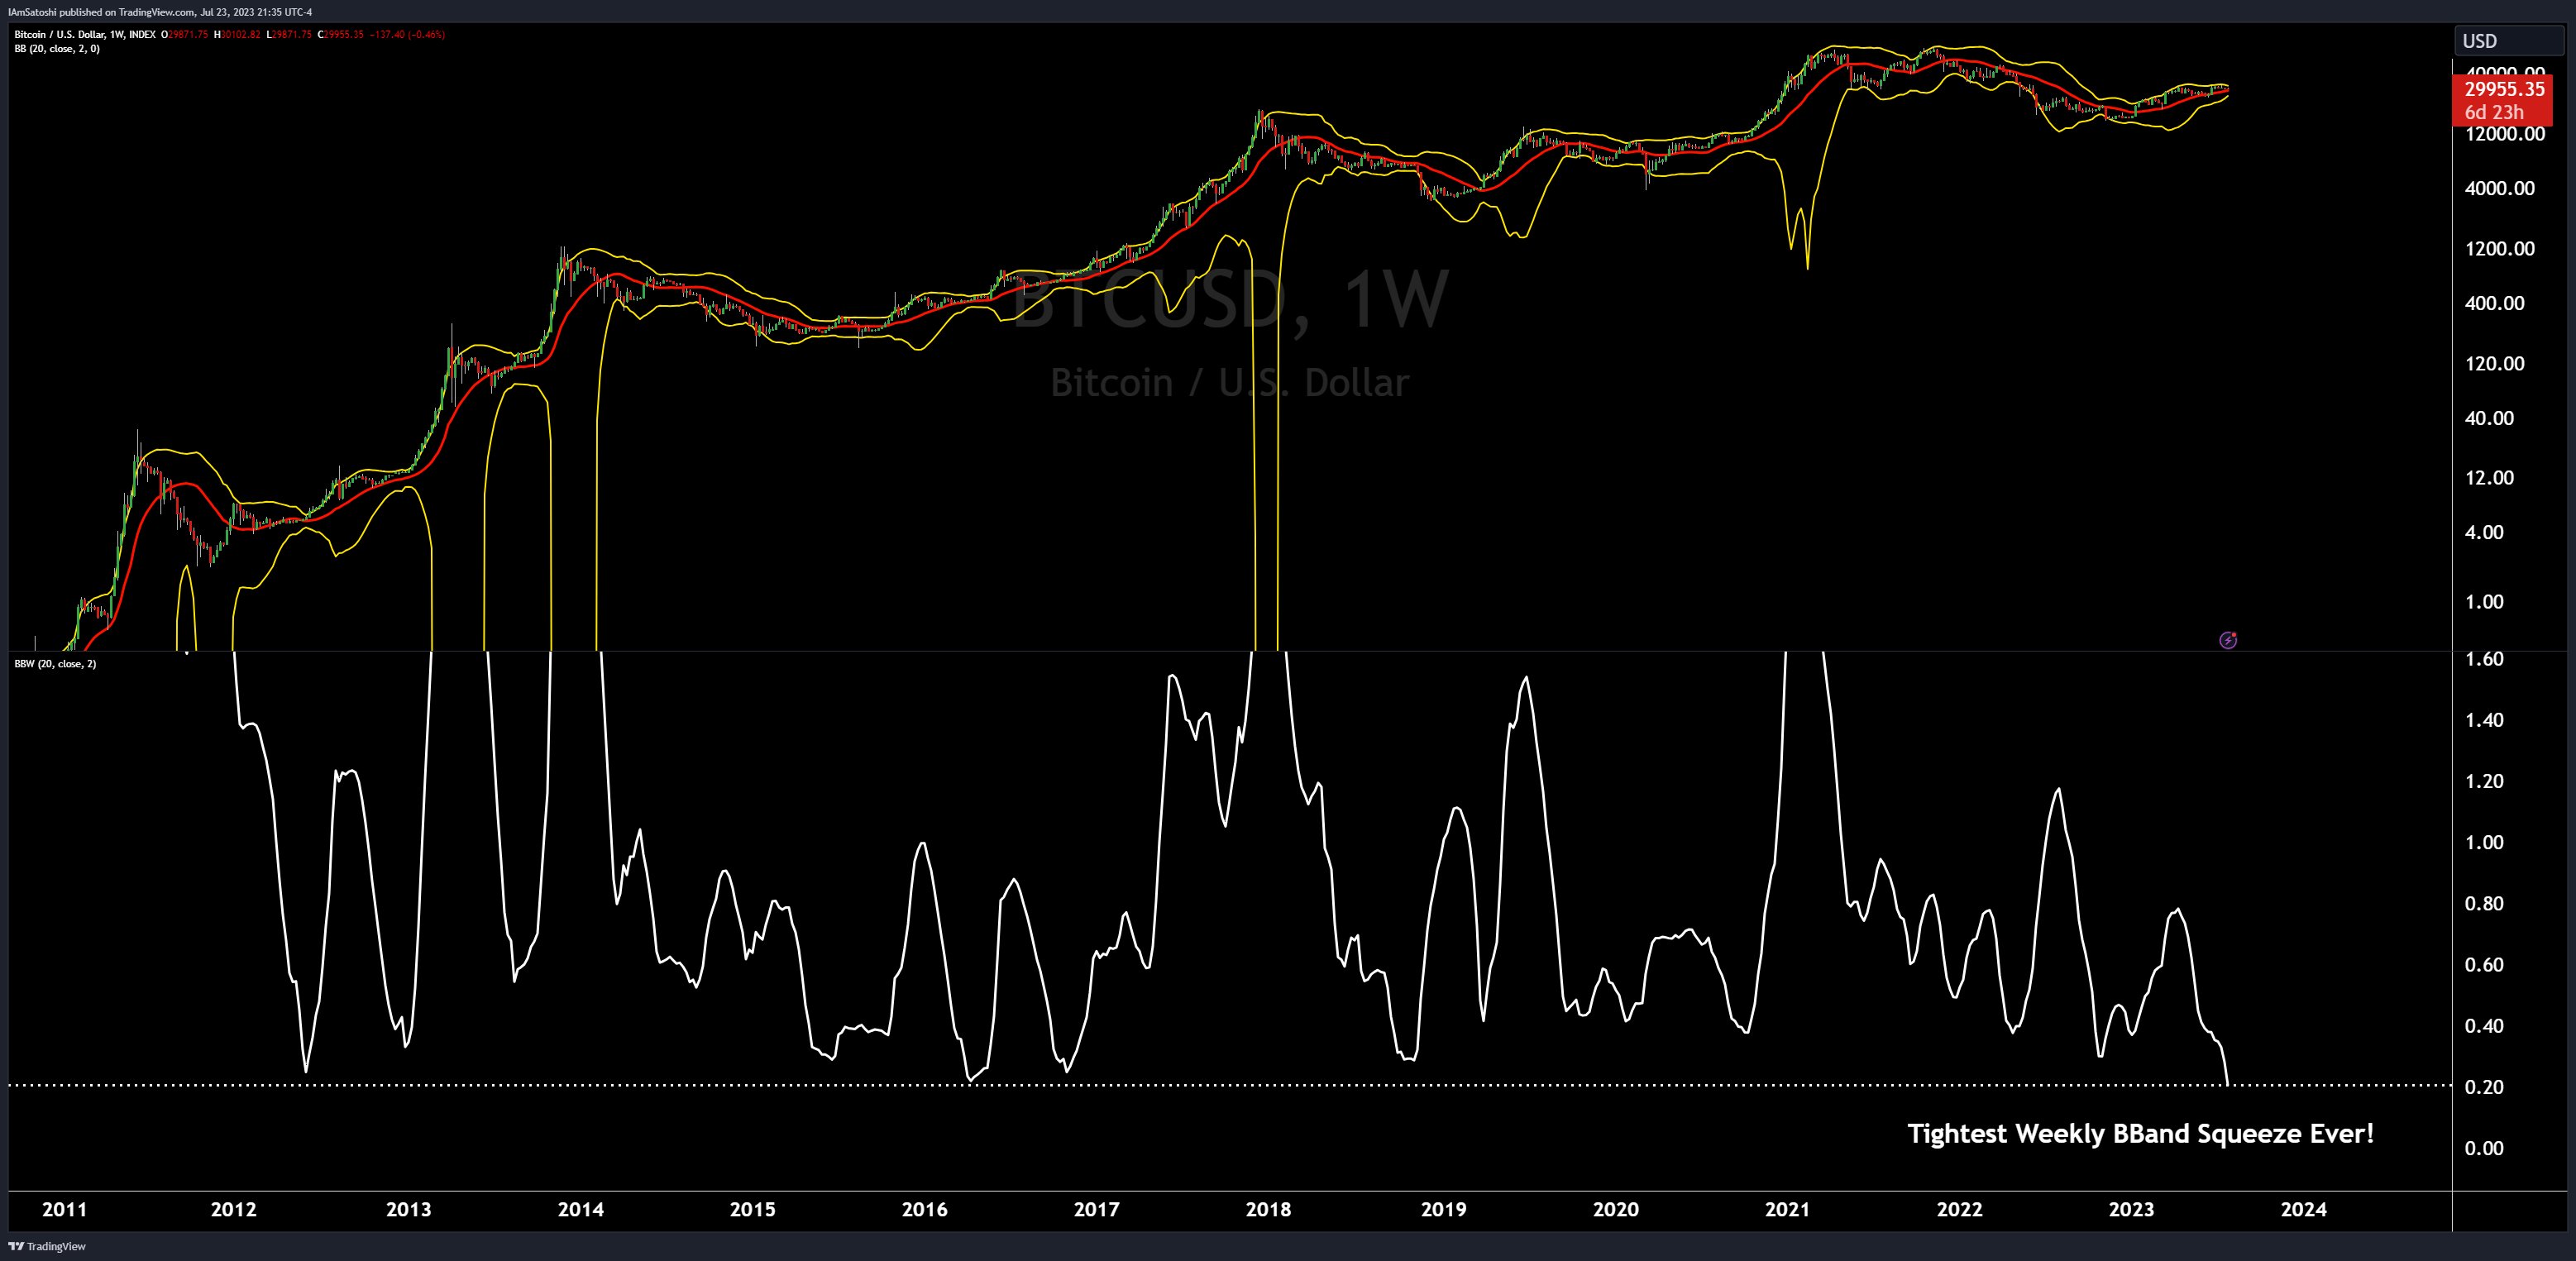
With uncharacteristic tranquility, Bitcoin's market volatility seems to be at a historic low, according to a key technical metric.
Noted cryptocurrency analyst Josh Olszewicz observed that Bitcoin's Bollinger Bands, a volatility indicator used in technical analysis, are "the tightest [they] have ever been on the weekly timeframe."

Bollinger Bands are a type of statistical chart used to analyze the price and volatility over time for a financial instrument, with the tightening of these bands suggesting reduced price fluctuations.
Bollinger Bands consist of a simple moving average (SMA) line, with two standard deviation lines plotted above and below it. The area between the two bands represents the expected trading range of the asset.
When the bands are narrow, it signals that the market is less volatile, and vice versa. In Bitcoin's case, Olszewicz's observation suggests that the cryptocurrency's price is currently in a phase of limited volatility.
Interestingly, this volatility contraction is not exclusive to Bitcoin. Olszewicz also mentioned that Ethereum (ETH), the second largest cryptocurrency by market cap, is experiencing the "tightest B-Bands on weekly timeframe ever."
This simultaneous constriction could indicate a broader market trend, making the crypto market more predictable, albeit less exciting for traders seeking larger swings.
Bitcoin exchange balances plunge
In a separate but related note, CryptoQuant has reported that Bitcoin exchange balances have dropped to levels last seen at the start of 2018.
The analytics platform states that "11% of the circulating supply is currently on exchanges," down from 17% in March 2020. This trend could suggest an increasing preference for holding Bitcoin long term, rather than trading it, further contributing to the current low-volatility environment.

 Yuri Molchan
 Godfrey Benjamin
 Gamza Khanzadaev
 Alex Dovbnya