*** Please note the analysis below is not investment advice. The views and opinions expressed here are solely those of the author and do not necessarily reflect the views of U.Today. Every investment and trading move involves risk, you should conduct your own research when making a decision.
Bitcoin has seven failed attempts
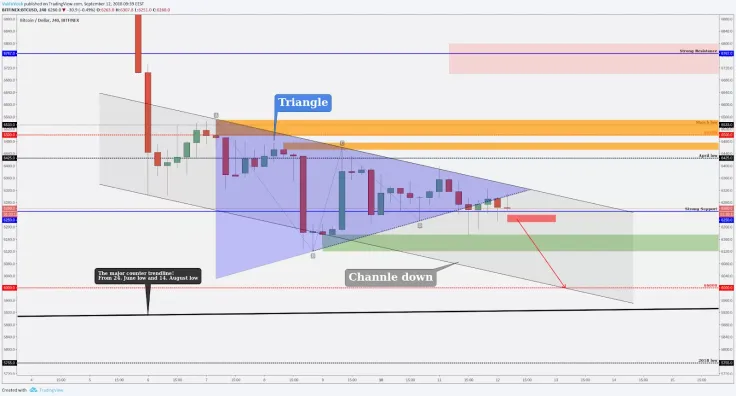
Now we have been in this consolidation phase a little bit over six days. Currently, BTC price has drawn us a "Triangle" pattern and we have a down channel where the price moves downwards.

Yesterday we got a small sign that the price may come down and test the lower levels. It made a breakout from the triangle downwards which is a bearish sign, but currently, on the four-hour chart, we could see that there is a very strong level- $6,250.
BTC price has tried to break this seven times but all those attempts were unsuccessful and it bounced back above the mentioned level. So, basically, we have a sign that we may go downwards from triangle breakout, now, if we get a close below the $6,250 this could mean that there is a very high probability to go test the lower levels. If we start to drop then the first support is $6,000 where we want to watch what the price action does but we think it will go much lower than $6,000 but let's see and let’s take this step-by-step.
If we start to go higher then you already know our resistances from yesterday’s post.
Litecoin (LTC/USD) is on the important area
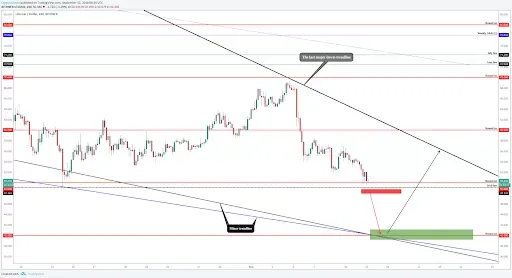
If some alts are approaching the 2018 low point then Litecoin is almost there. Currently, LTC price is on the very important support area- $50 which starts to work as a support and the 2018 low which was made on Aug. 14.

If we don't find that power to hold the price above $50 then bearish confirmation would be a four-hour candle close below the 2018 low (red box).
A break below the 2018 low could mean bad news for LTC because there are exactly zero recent supports until the next round number area of $40. There are also two different trendlines pulled from different wicks and lows (let's call those trendlines the minor trendlines) and they make a cross on the $40 level + there is also some Fibonacci extension areas. So, this means the next support area and a pretty significant one is around $40.
To trade between the $50 and $40 level is pointless and very risky. Because technically there is almost nothing remarkable. Wait for $40 or if the price doesn't reach into this are then wait for our technical analysis, we will try to keep you posted.
Tron (TRX/USD) is approaching the key area
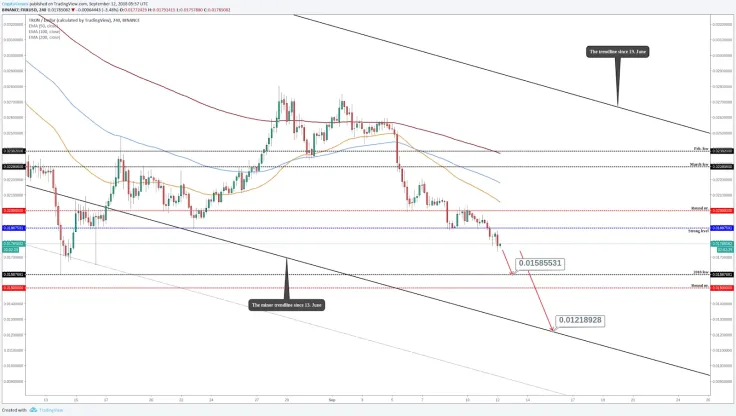
If we take a look at Tron’s four-hour chart then it has dropped below the round number $0.02 and below the strong support which was around $0.0188 and looks like there is room to go even lower.

TRX possible next targets/supports are the 2018 low which occurred on Aug. 14. In this price level, we have to watch what BTC does, if it also finds the support, from let's say from $6,000, then it would be good for Tron also since those distances are almost the same.
Around the 2018 low, we have a round number of $0.015 which could start to support the price.
If TRX price doesn't catch the momentum from the mentioned level then we might go and touch the minor trendline which is pulled from the June 13 wick and we may go as low as $0.011-$0.013.
So, currently investing in Tron is not recommended because there is room to go lower and the market is on the selling pressure.
Hopefully, those levels and this analysis helped you out a little bit to confirm your own analysis.
 Tomiwabold Olajide
 Caroline Amosun