Disclaimer: The opinions expressed by our writers are their own and do not represent the views of U.Today. The financial and market information provided on U.Today is intended for informational purposes only. U.Today is not liable for any financial losses incurred while trading cryptocurrencies. Conduct your own research by contacting financial experts before making any investment decisions. We believe that all content is accurate as of the date of publication, but certain offers mentioned may no longer be available.
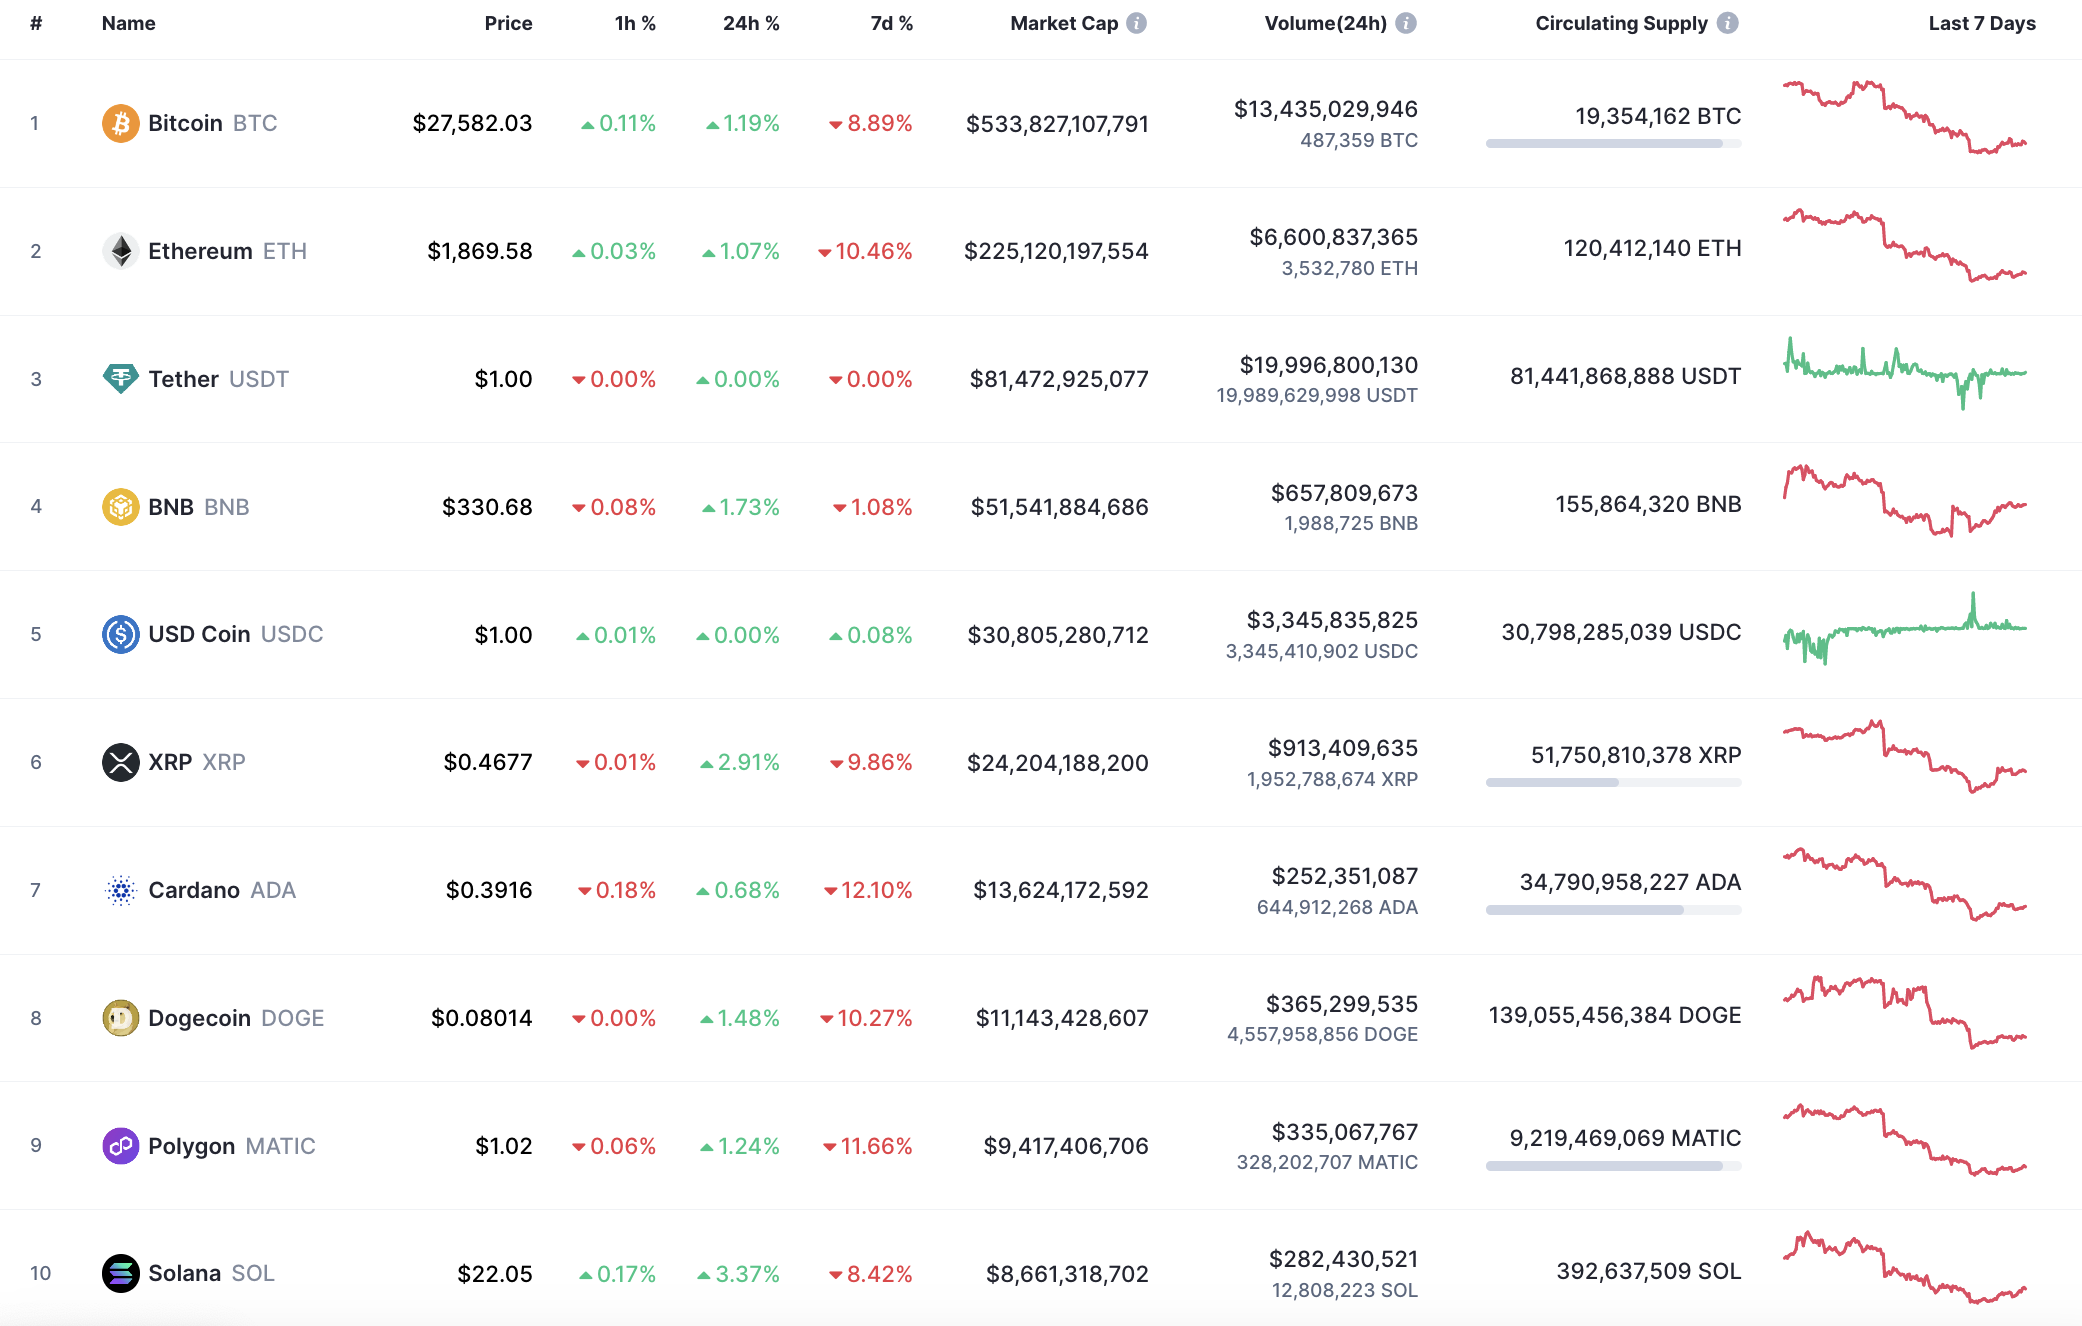
Buyers are not giving up so easily, according to the CoinMarketCap ranking.
BTC/USD
The price of Bitcoin (BTC) has increased by 1.19% over the last day.
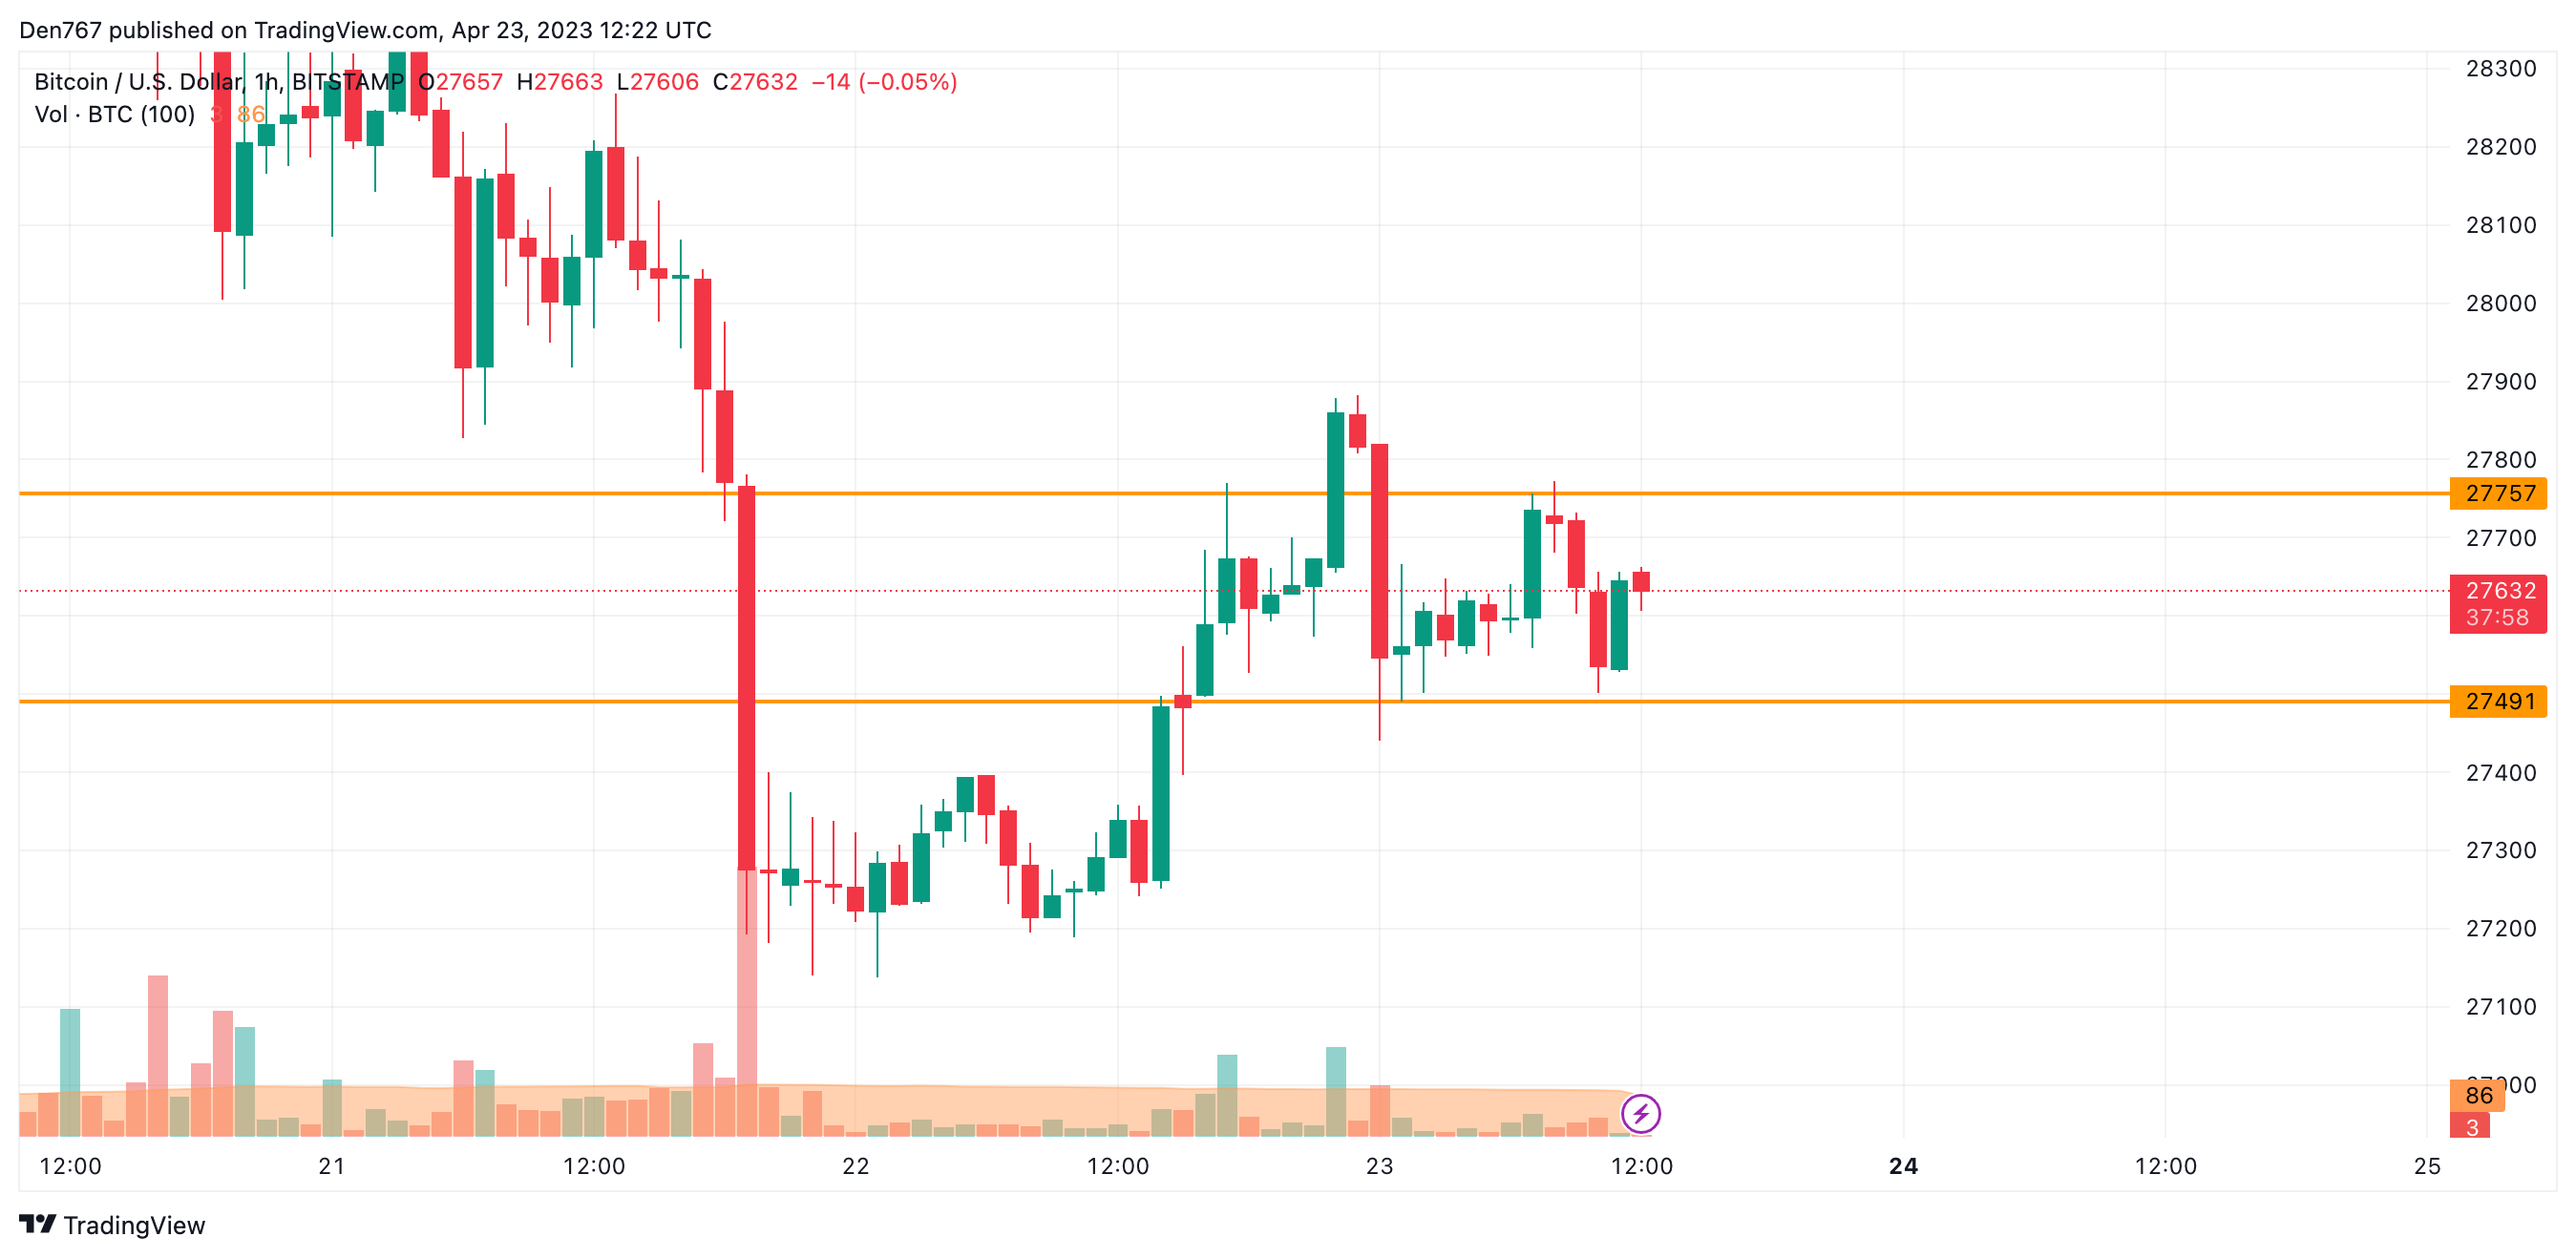
On the hourly chart, the price is trading in the middle of the narrow channel between the support at $27,491 and the resistance at $27,757.

If closure happens near the $27,700 mark or above, the breakout may lead to a blast to the $27,900-$28,000 area tomorrow.
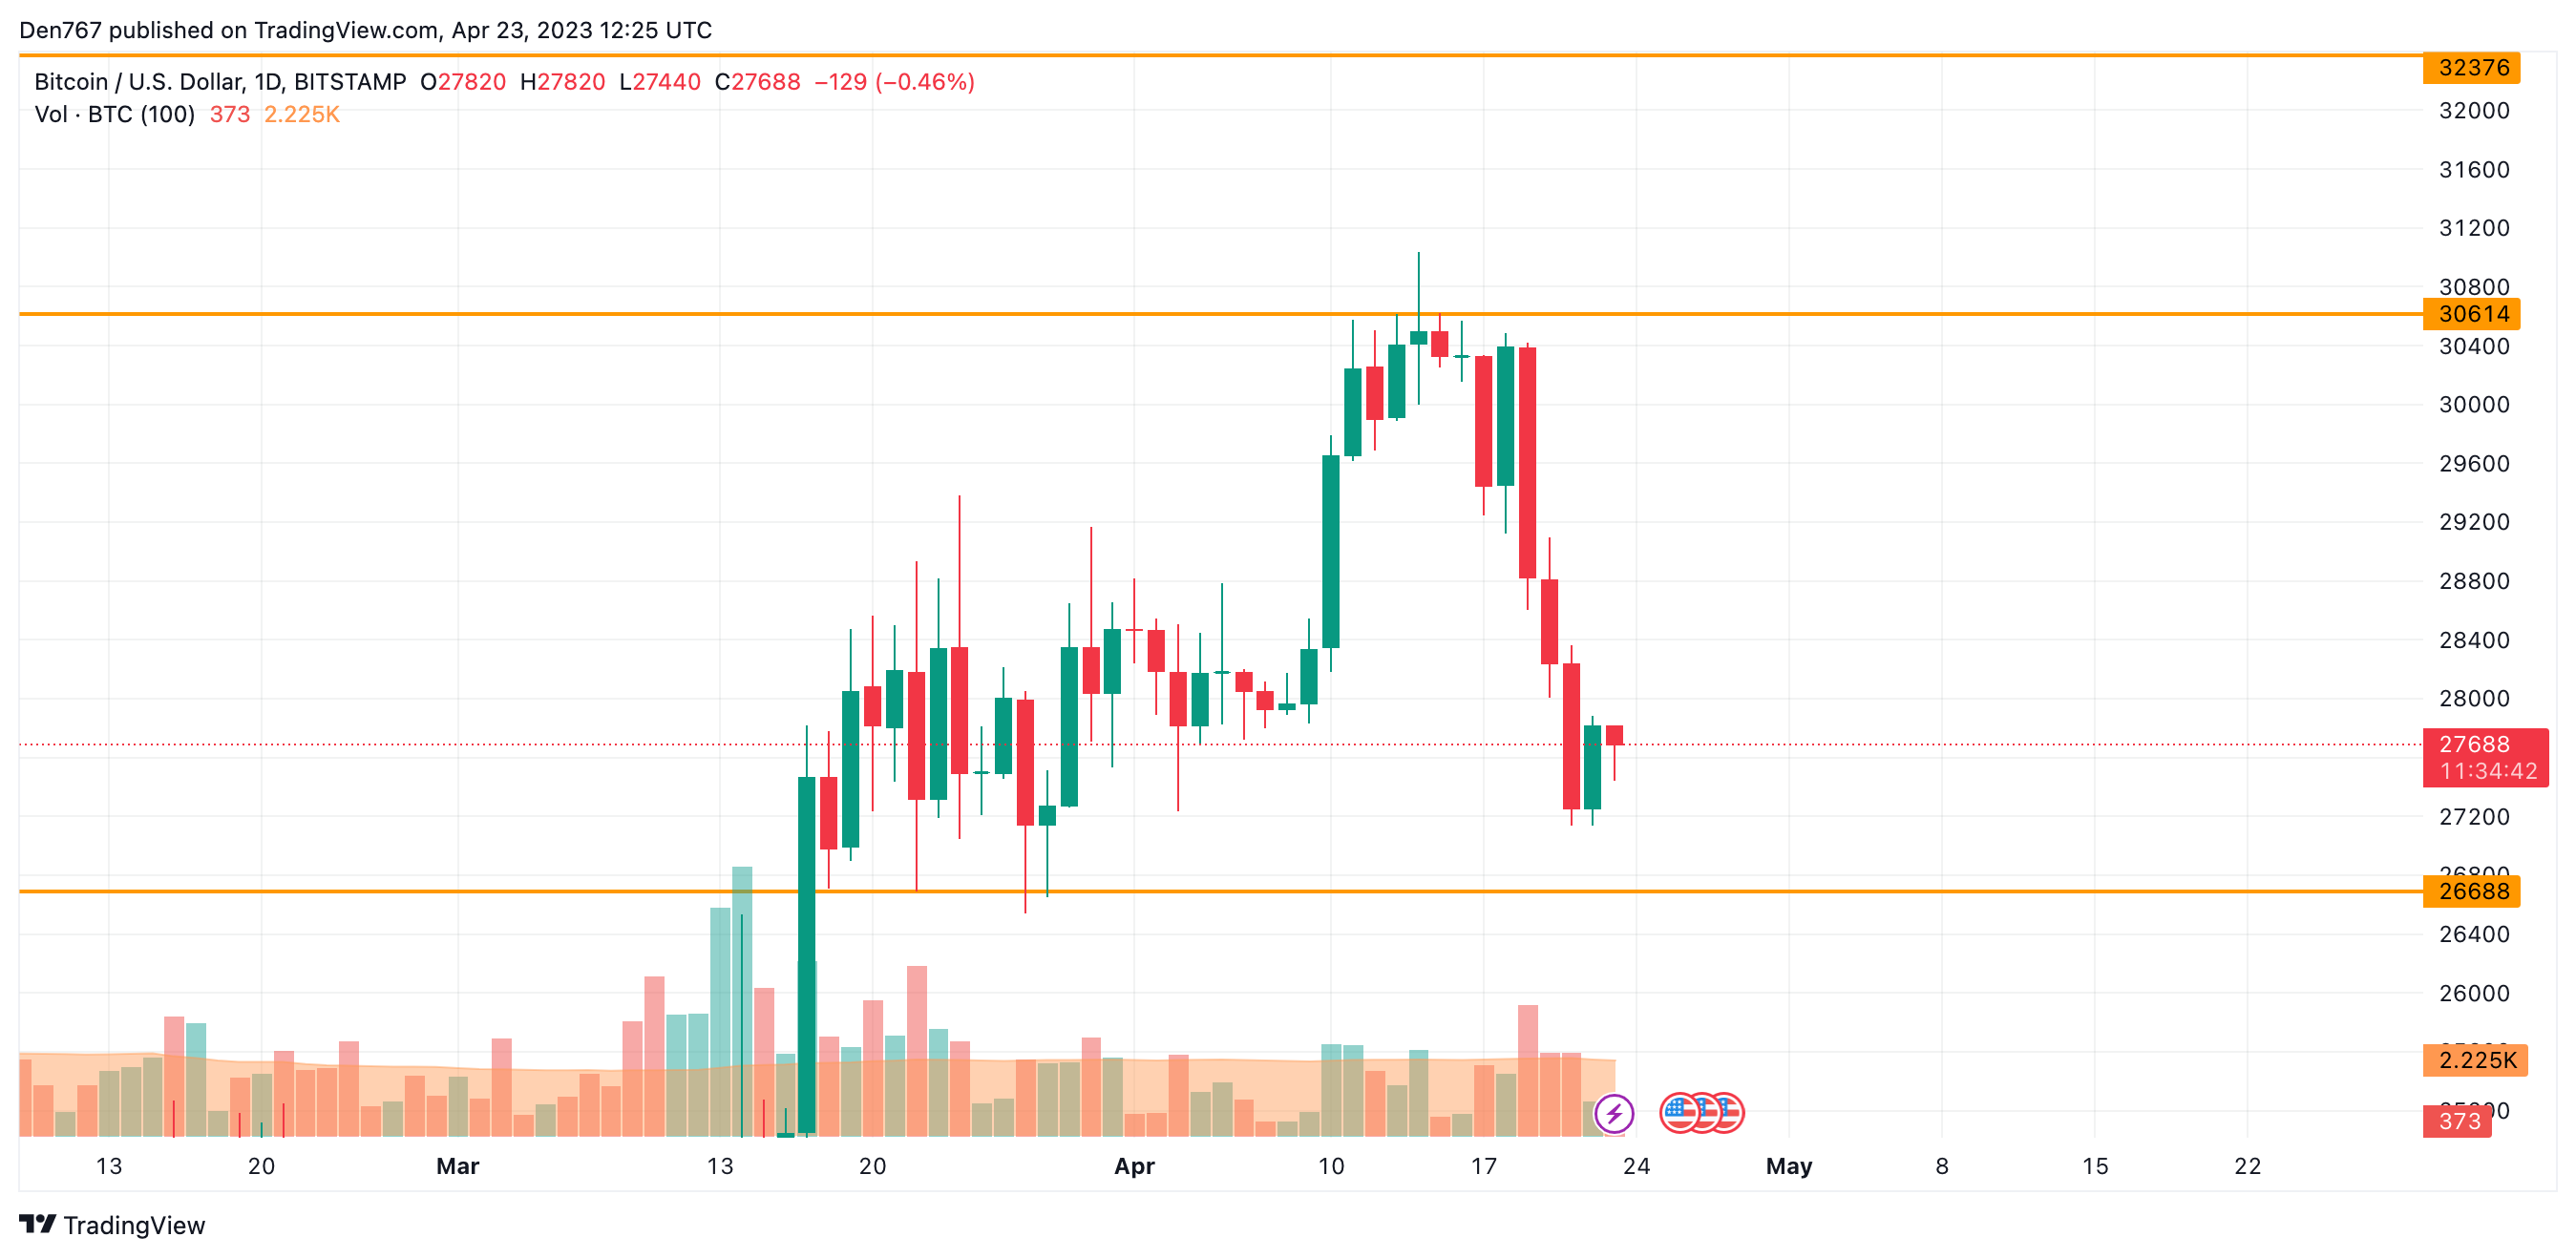
The rate of Bitcoin (BTC) has reached the zone of interest of buyers ($27,000-$28,000). If sellers' pressure continues and the bar closes near the support at $26,688, there is a chance to see a further drop to the $26,000 area next week.
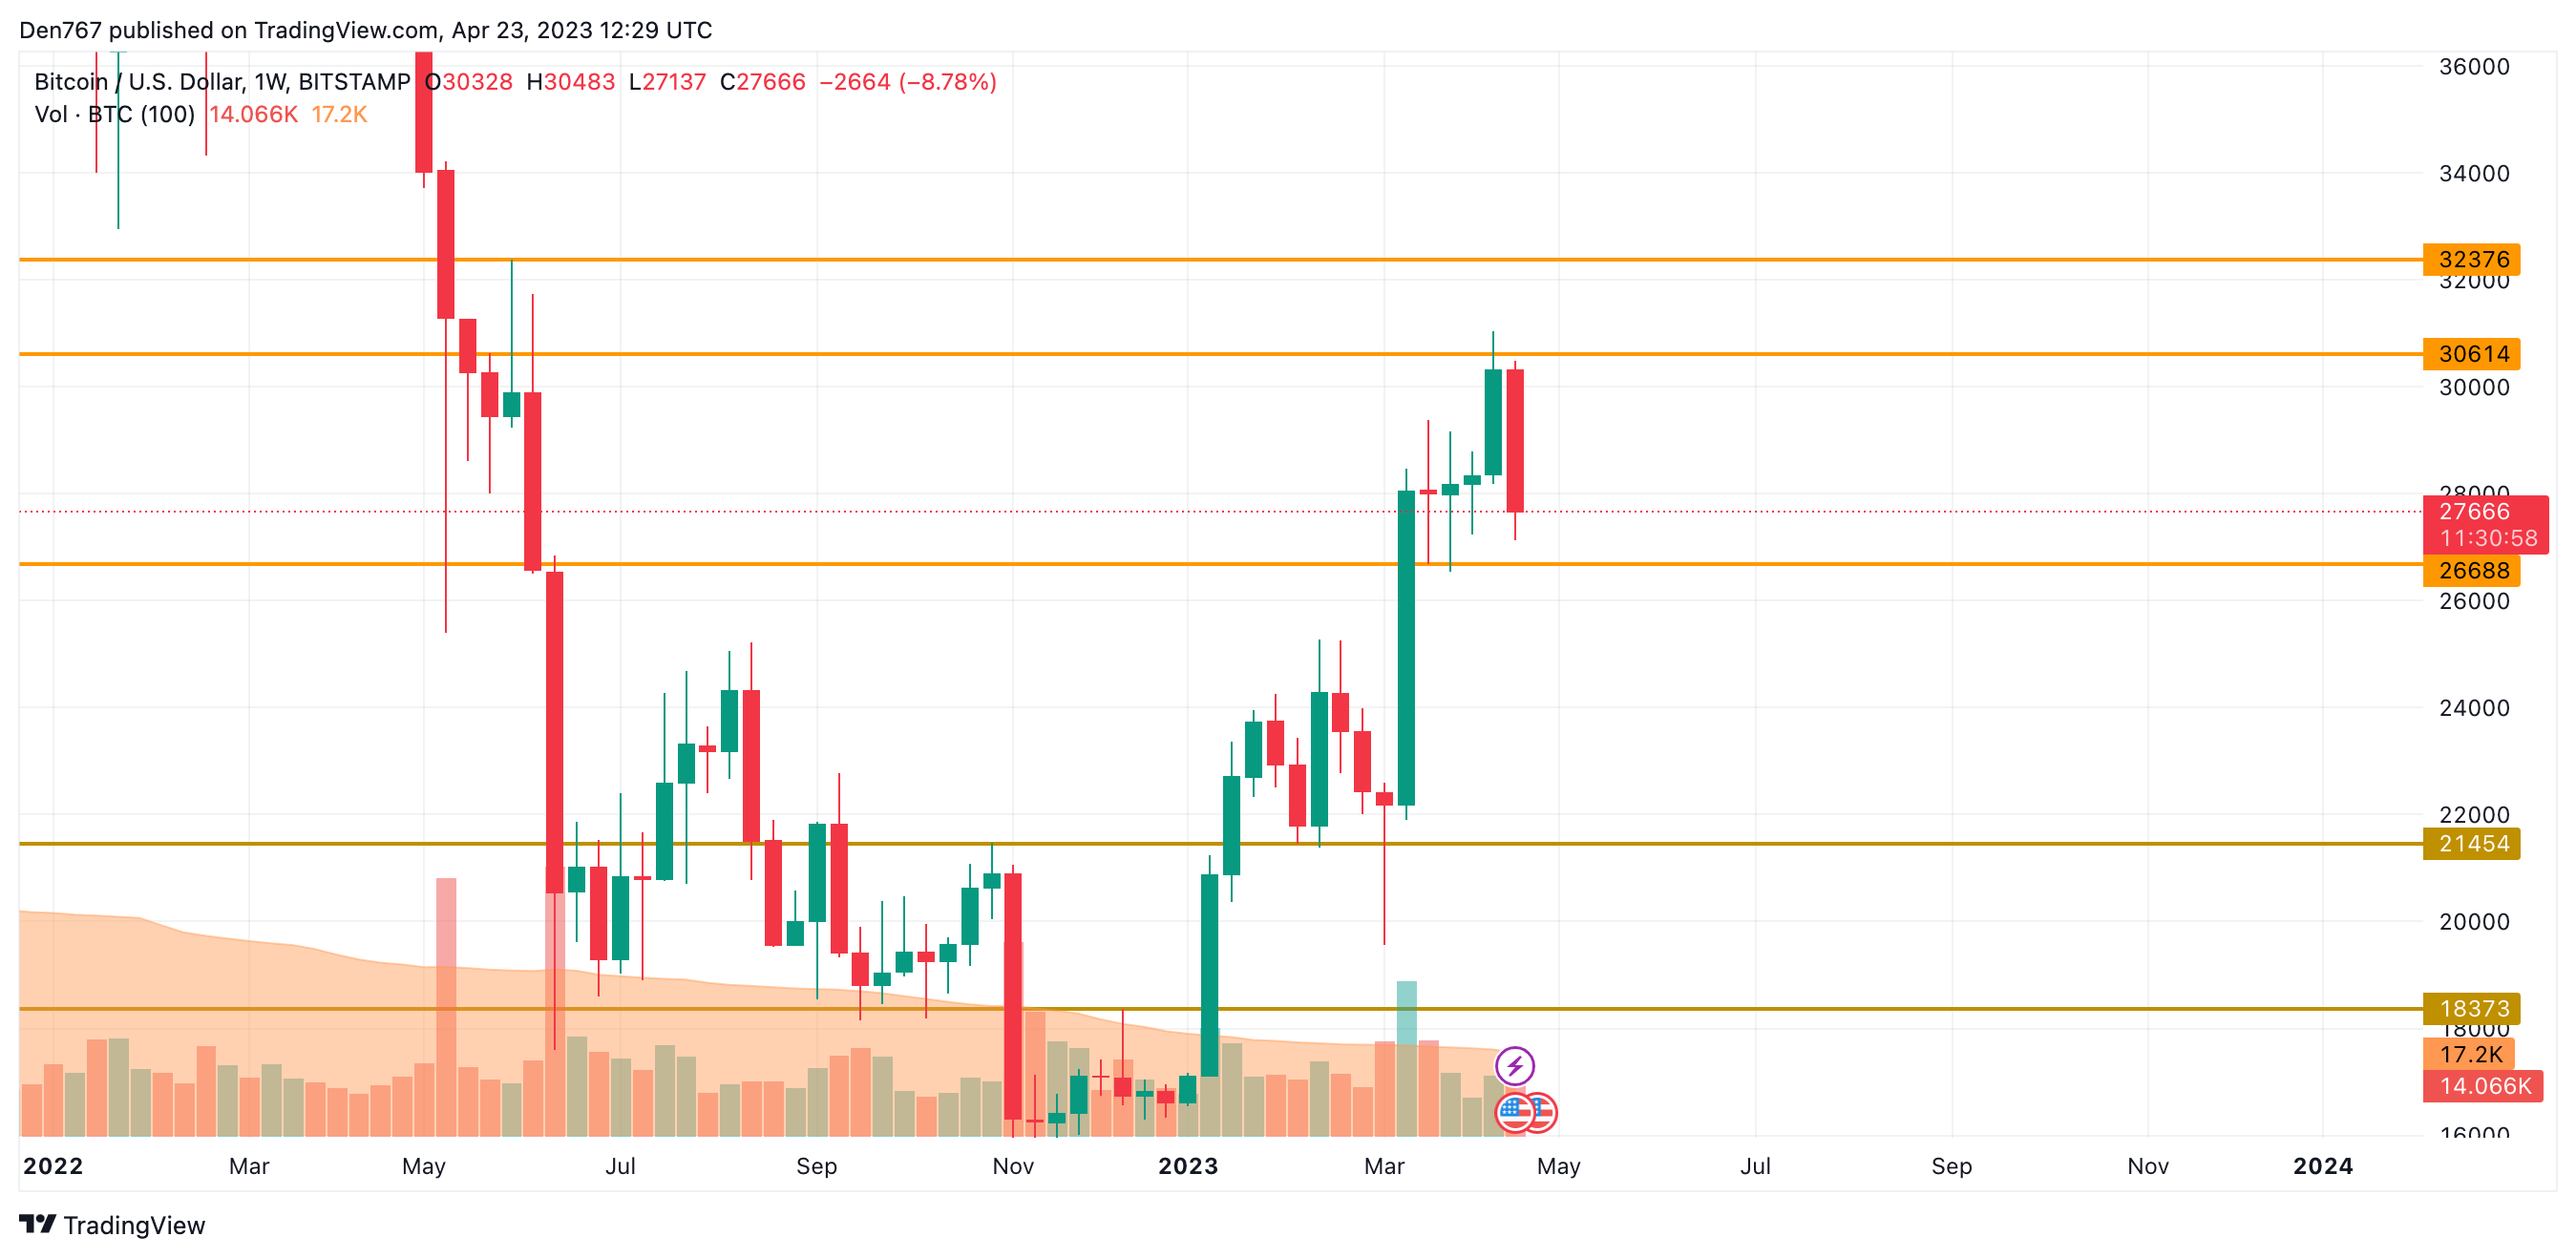
A similar situation is on the weekly time frame. However, if a breakout happens, the drop can be more profound and lead to a decline to the $24,500-$25,000 zone. Such a scenario is relevant until mid-May.
Bitcoin is trading at $27,713 at press time.
 Dan Burgin
 U.Today Editorial Team