
Disclaimer: The opinions expressed by our writers are their own and do not represent the views of U.Today. The financial and market information provided on U.Today is intended for informational purposes only. U.Today is not liable for any financial losses incurred while trading cryptocurrencies. Conduct your own research by contacting financial experts before making any investment decisions. We believe that all content is accurate as of the date of publication, but certain offers mentioned may no longer be available.
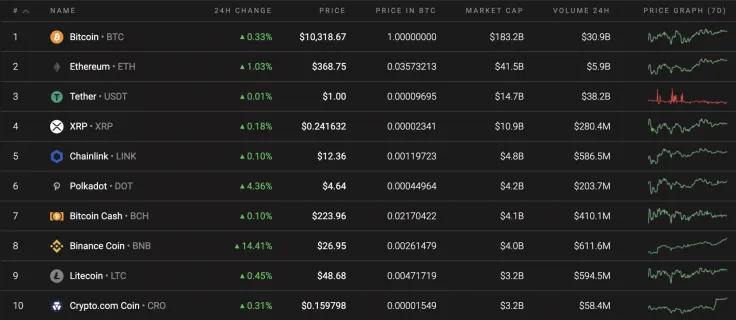
The first day of the weekend has turned out to be bullish for the cryptocurrency market. All Top 10 coins are in the green zone against the top leader—Binance Coin (BNB).
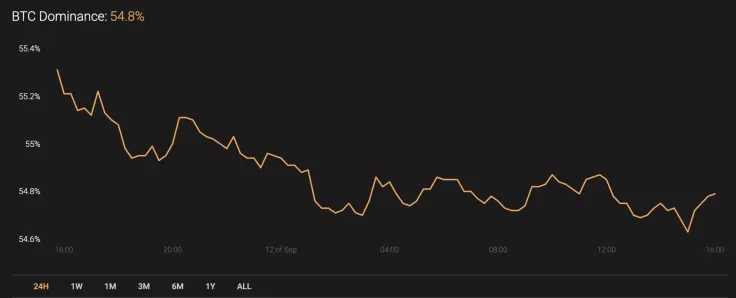
The dominance rate of Bitcoin (BTC) keeps declining, and the current index is 54.8%.
The key Bitcoin data today:
-
Name: Bitcoin
Advertisement -
Ticker: BTC
-
Market Cap: $191,088,026,818
-
Price: $10,336.37
Advertisement -
Volume (24h): $87,274,062,299
-
Change (24h): 0.37%
The data is relevant at press time.
BTC/USD: Has the correction finished yet?
The past week was neither bullish nor bearish for Bitcoin (BTC). The rate of the leading crypto is almost unchanged over the last seven days.
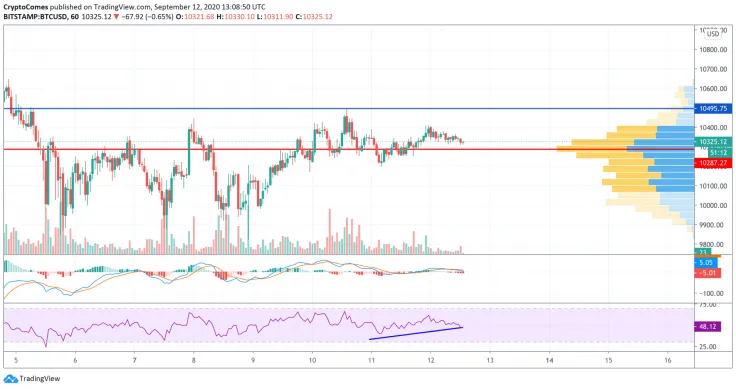
On the hourly chart, Bitcoin (BTC) is trading sideways. However, the price blast is likely to occur upwards as the Relative Strength Index indicator has formed a bullish divergence. It is too early to consider the continuation of the bull run, as buyers are not so powerful based on the low trading volume. To conclude, a short-term rise is possible to the crucial $10,500 mark.
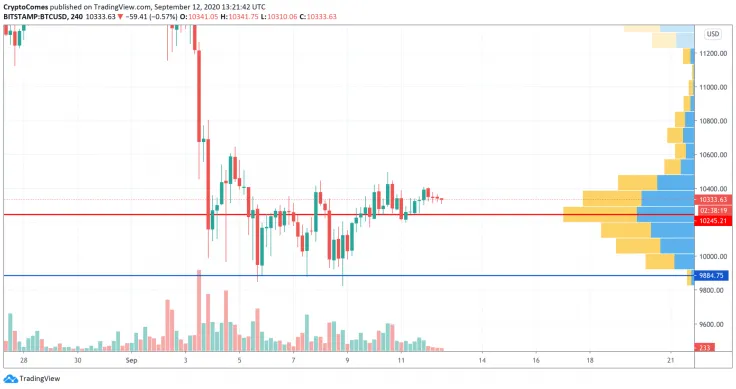
On the longer time frame, the situation is the opposite. Bulls have not gained enough liquidity to keep growing. That is why there is a great likelihood of seeing a drop to the area of $9,800-$9,900 shortly.

From those levels, one may expect a false breakout. Such a scenario is relevant for the upcoming week.
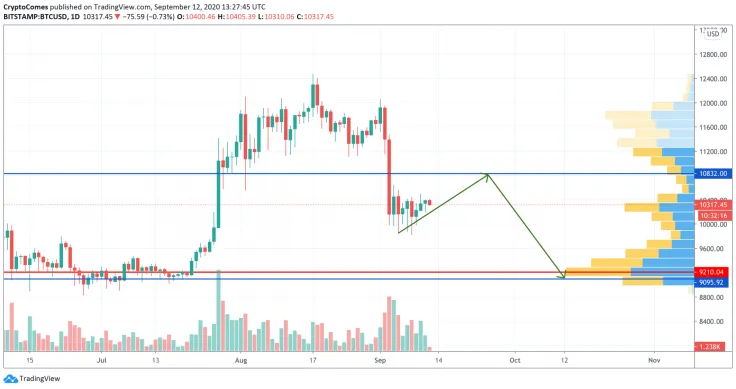
On the daily chart, traders may consider one more decline wave to $9,100. There is a high concentration there, which means that it is the last drop before new, continued growth to $12,000 and above. The following decline may happen in October 2020, followed by new peaks in November.
Bitcoin is trading at $10,293 at press time.
 Dan Burgin
 U.Today Editorial Team