Disclaimer: The opinions expressed by our writers are their own and do not represent the views of U.Today. The financial and market information provided on U.Today is intended for informational purposes only. U.Today is not liable for any financial losses incurred while trading cryptocurrencies. Conduct your own research by contacting financial experts before making any investment decisions. We believe that all content is accurate as of the date of publication, but certain offers mentioned may no longer be available.
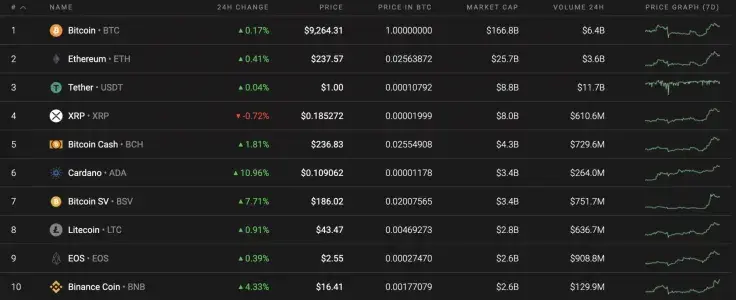
The second part of Tuesday remains under bullish influence. However, not as much as it was yesterday. Almost all of the coins from the top 10 list are in the green zone, except for XRP, whose price has declined 0.72% over the past 24 hours.
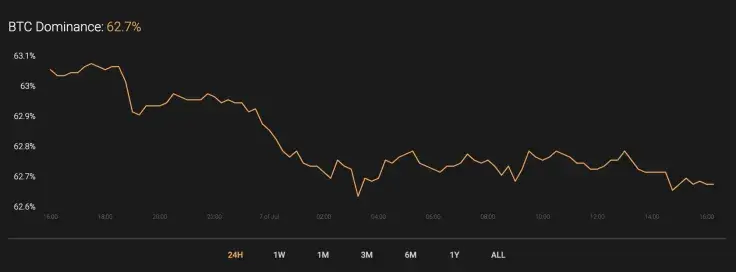
Against the increasing dominance of altcoins, the market share of Bitcoin (BTC) has fallen slightly and now makes up 62.7%.
The relevant data for XRP is as follows.
-
Name: XRP
Advertisement -
Ticker: XRP
-
Market Cap: $8,177,810,436
-
Price: $0.184777
Advertisement -
Volume (24h): $1,259,302,173
-
Change (24h): -0.92%
The data is relevant at press time.
XRP/USD: Has the growth ended? Have bears returned?
Yesterday, the bull attack led to an intense increase in the price of XRP in the resistance area of $0.19. After a re-test of this level, the volume of purchases decreased and the bears pushed the price to the area of $0.187.
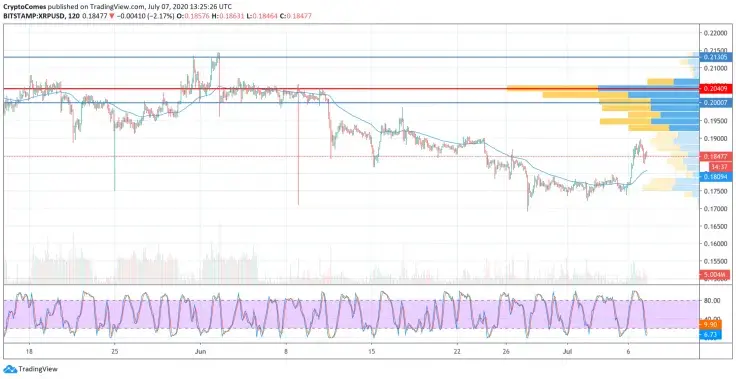
Judging by the short pullback, the price recovery may continue. If growth is not supported by large volumes, then the dynamics will slow down and recovery will stop at $0.195. The pair will not be able to gain a foothold in the zone of the maximum and will roll back to the region of average prices.
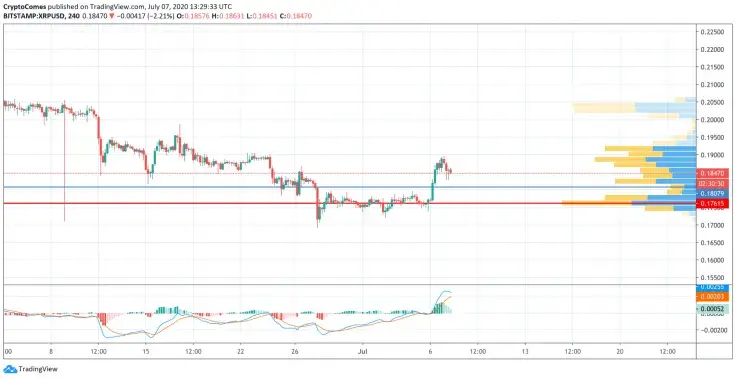
On the 4H time frame, the correction has already begun. The decline is confirmed by the lines of the MACD indicator, which are about to enter the red zone. What is more, there is a high level of liquidy below, in the area between $0.1750 and $0.18. Summing up, the most likely price projection is an ongoing decrease to $0.18, which bears may reach within days.
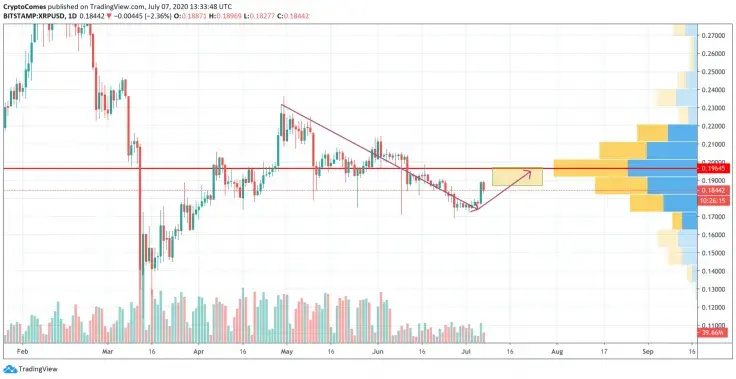
On the daily time frame, the bearish trend has almost solidified. However, the last bullish candle, with almost no shadow, has confirmed bulls' pressure. In addition, the trading volume is not declining, which means that sellers are running out of steam. All in all, sideways trading has continued to dominate within the $0.1870-$0.1970 range.
XRP is trading at $0.1850 at press time.
 U.Today Editorial Team
 Dan Burgin