
Disclaimer: The opinions expressed by our writers are their own and do not represent the views of U.Today. The financial and market information provided on U.Today is intended for informational purposes only. U.Today is not liable for any financial losses incurred while trading cryptocurrencies. Conduct your own research by contacting financial experts before making any investment decisions. We believe that all content is accurate as of the date of publication, but certain offers mentioned may no longer be available.
XRP has been in the limelight with a significant upward move that has seen it break above the 50-day Simple Moving Average (SMA). The token is now trading above all moving averages, indicating bullish sentiment among traders. However, the sustainability of this rally remains a critical question for investors.
The break above the 50 SMA is typically perceived as a bullish signal. By trading above all moving averages, XRP is suggesting strong buying momentum. However, with the Relative Strength Index (RSI) slowly inching toward 60 and overall trading volume in a descending trend, investors should remain cautious.
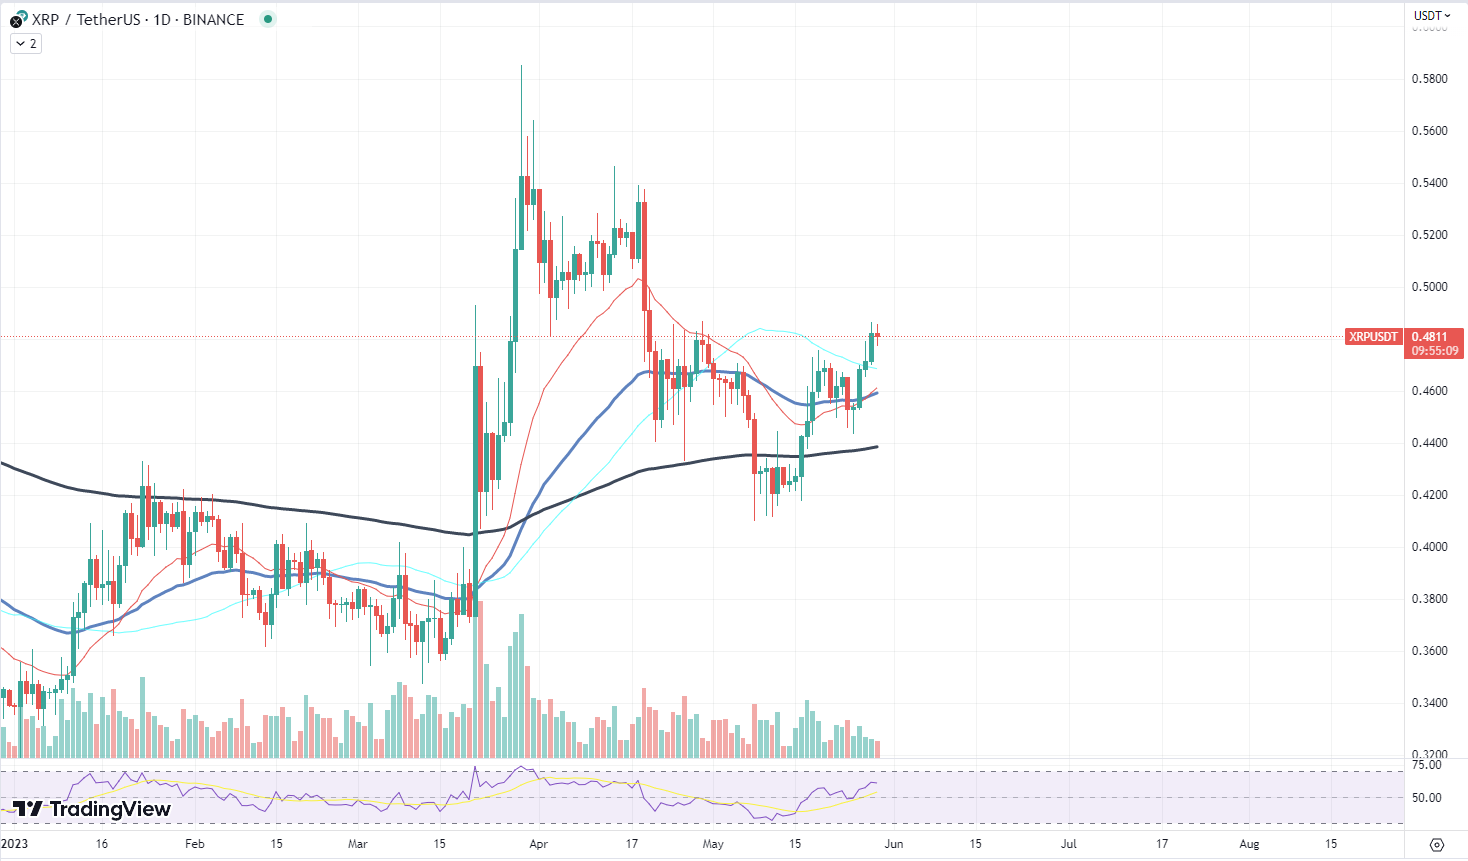
The RSI is a momentum indicator used in technical analysis that measures the magnitude of recent price changes to evaluate overbought or oversold conditions. An RSI above 60 typically suggests bullish market conditions. However, a rising RSI coupled with decreasing trading volumes often signifies a bearish divergence, indicating that the rally may be losing steam and a price correction might be on the horizon.
It is crucial to note that while the current trend seems promising, the long-term sustainability of this rally heavily depends on broader market sentiment, changes in trading volume and potential fundamental developments within the Ripple network. Investors should also keep a close eye on the RSI. If it continues to rise against the backdrop of decreasing trading volume, the rally could be short-lived.
Cardano moving upward
Cardano (ADA) has recently shown a promising recovery after a successful bounce off the local trendline at around $0.35. As it has started its upward journey, breaking through the 50-day Exponential Moving Average (EMA), market watchers now focus their attention on the next major resistance: the 200-day EMA.
The recent movement has generated bullish sentiment on the ADA market, particularly as the price momentum also aligns with the broader crypto market recovery. The bounce back from the $0.35 trendline has been a pivotal event as it signals a strong support level for ADA. This strong rebound suggests that there is robust buying interest in ADA at this price level.
In its ascent, ADA has managed to break through the 50-day EMA, a significant short-term bullish signal. The next target appears to be the 200-day EMA. However, before reaching this point, ADA will have to encounter a couple of psychological resistance levels. The previous cycle high was at $0.45, and the next significant resistance was noted at $0.4. The token will need to sustain its upward momentum and break through these resistance levels to continue its bullish trajectory toward the 200-day EMA.
Dogecoin aiming upward
The network metrics of the famous meme-inspired cryptocurrency are showing signs of recovery. After a period of subdued activity, Dogecoin has recently experienced a surge in network activity and trading volumes across various exchanges. Despite this renewed interest, the price of DOGE has been hovering around the local lows of $0.07. However, signs are pointing to a potential rally that could push DOGE to its previous rally high of $0.09.
The recovery in DOGE's network metrics provide a glimmer of optimism for the meme coin's followers. This upward trend in network activity is often associated with increased user interest and could indicate a potential price surge. Escalating trading volumes across multiple platforms are particularly encouraging as they reflect a heightened market appetite for DOGE.
Nevertheless, the current price of DOGE, sitting around $0.07, shows a discrepancy between network activity and market value. This divergence might suggest that Dogecoin is currently undervalued and poised for a price breakout. If this sentiment takes hold, we could see DOGE begin to climb and potentially reach its previous rally high of $0.09.
 Dan Burgin