Disclaimer: The opinions expressed by our writers are their own and do not represent the views of U.Today. The financial and market information provided on U.Today is intended for informational purposes only. U.Today is not liable for any financial losses incurred while trading cryptocurrencies. Conduct your own research by contacting financial experts before making any investment decisions. We believe that all content is accurate as of the date of publication, but certain offers mentioned may no longer be available.
Ethereum was gaining traction on the market, but that severe and continuous consolidation that led to essentially nothing and just dragged ETH to around $3,800 was a crucial signal that was a hint at the future performance of the asset.
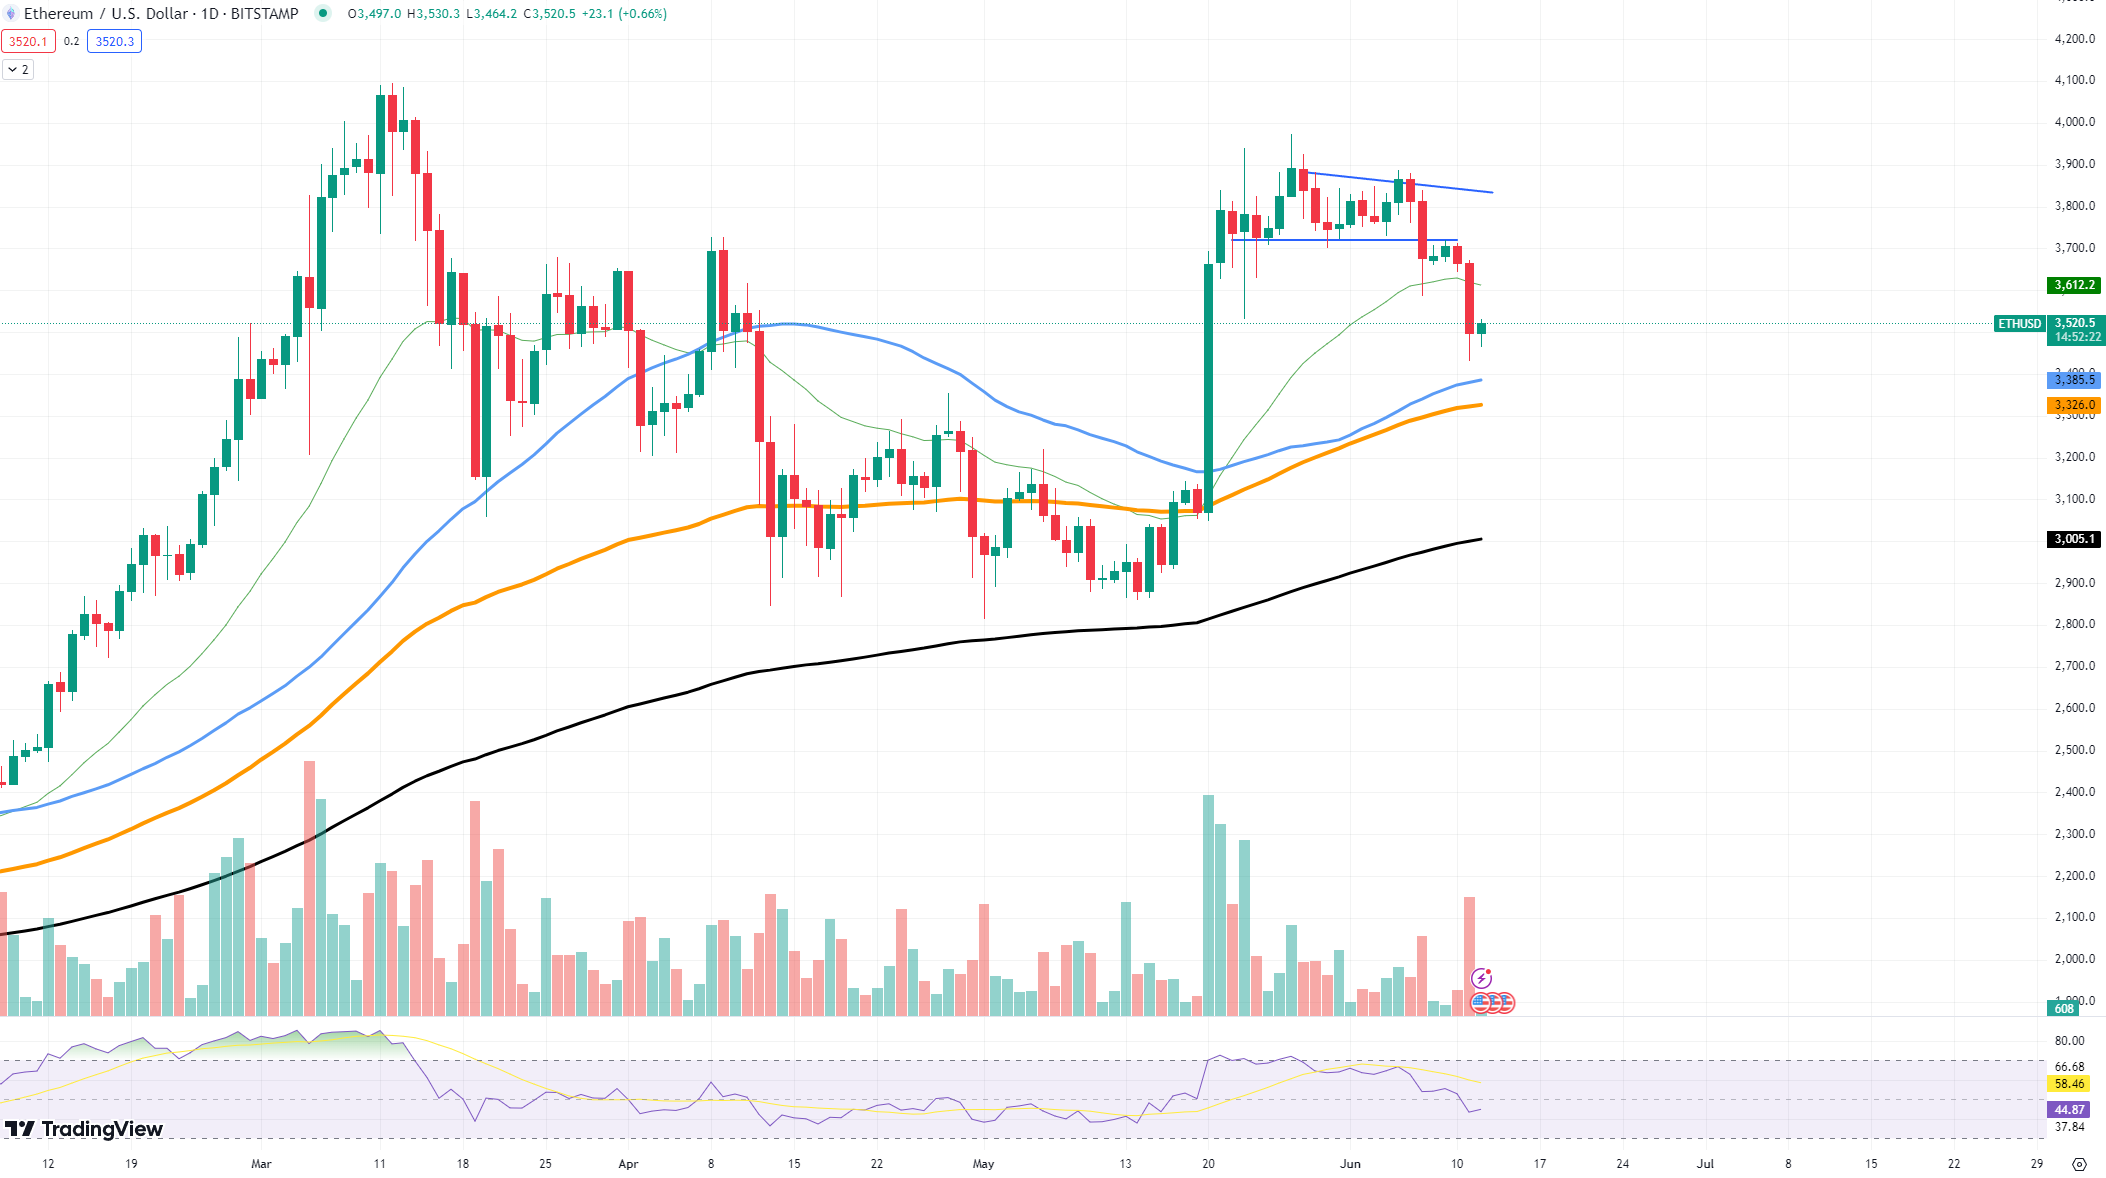
The price action of ETH has taken many traders by surprise despite its earlier strong momentum. Ethereum went through a phase of consolidation after encountering resistance at roughly $3,800. This sideways movement, which frequently portends market indecision here, portended the most recent decline that we have seen.

Ethereum experienced a significant decline in the last few days, reaching levels close to $3,500. The market had been feeling pretty bullish overall, so many people were taken aback by this abrupt decline. There could be a number of reasons behind this sudden action. First, problems with liquidity may be quite important.
Low liquidity can result in more pronounced price swings, as we have seen with different trading pairs on platforms such as Binance. In the case of Ethereum the recent decline may have been caused by an abrupt decrease in buying pressure, which would have made it simpler for sellers to drive the price lower. Macroeconomic variables also always come into play, as does investor sentiment.
Technical indicators indicate that ETH was heavily sold off in a short period of time. The Relative Strength Index (RSI) recently dipped into oversold territory. If buyers reenter the market, this can suggest the possibility of a rebound. Moving Averages (MAs) also exhibit a troubling pattern: shorter-term MAs cross below longer-term MAs, which is usually a sign of bearishness.

 Vladislav Sopov
 Dan Burgin