
Disclaimer: The opinions expressed by our writers are their own and do not represent the views of U.Today. The financial and market information provided on U.Today is intended for informational purposes only. U.Today is not liable for any financial losses incurred while trading cryptocurrencies. Conduct your own research by contacting financial experts before making any investment decisions. We believe that all content is accurate as of the date of publication, but certain offers mentioned may no longer be available.
Shiba Inu has encountered a stark market reversal, drawing the attention of investors and traders alike. The token, which had been rallying, recently experienced a precipitous drop in price, a movement characterized by what is known in the trading world as a "death candle." This term refers to a large, sudden red candle on the chart, which often signifies a strong reversal from bullish to bearish sentiment.
This unexpected turnover is reflective of a broader sentiment shift among SHIB holders, particularly so-called whales who hold substantial amounts of the token. These major players have begun to sell their holdings rapidly, a move that aligns with the market's logic considering the stalemate that precedes most corrections. The sudden increase in selling pressure from whales can create a cascade effect, leading to widespread sell-offs among smaller holders as well.
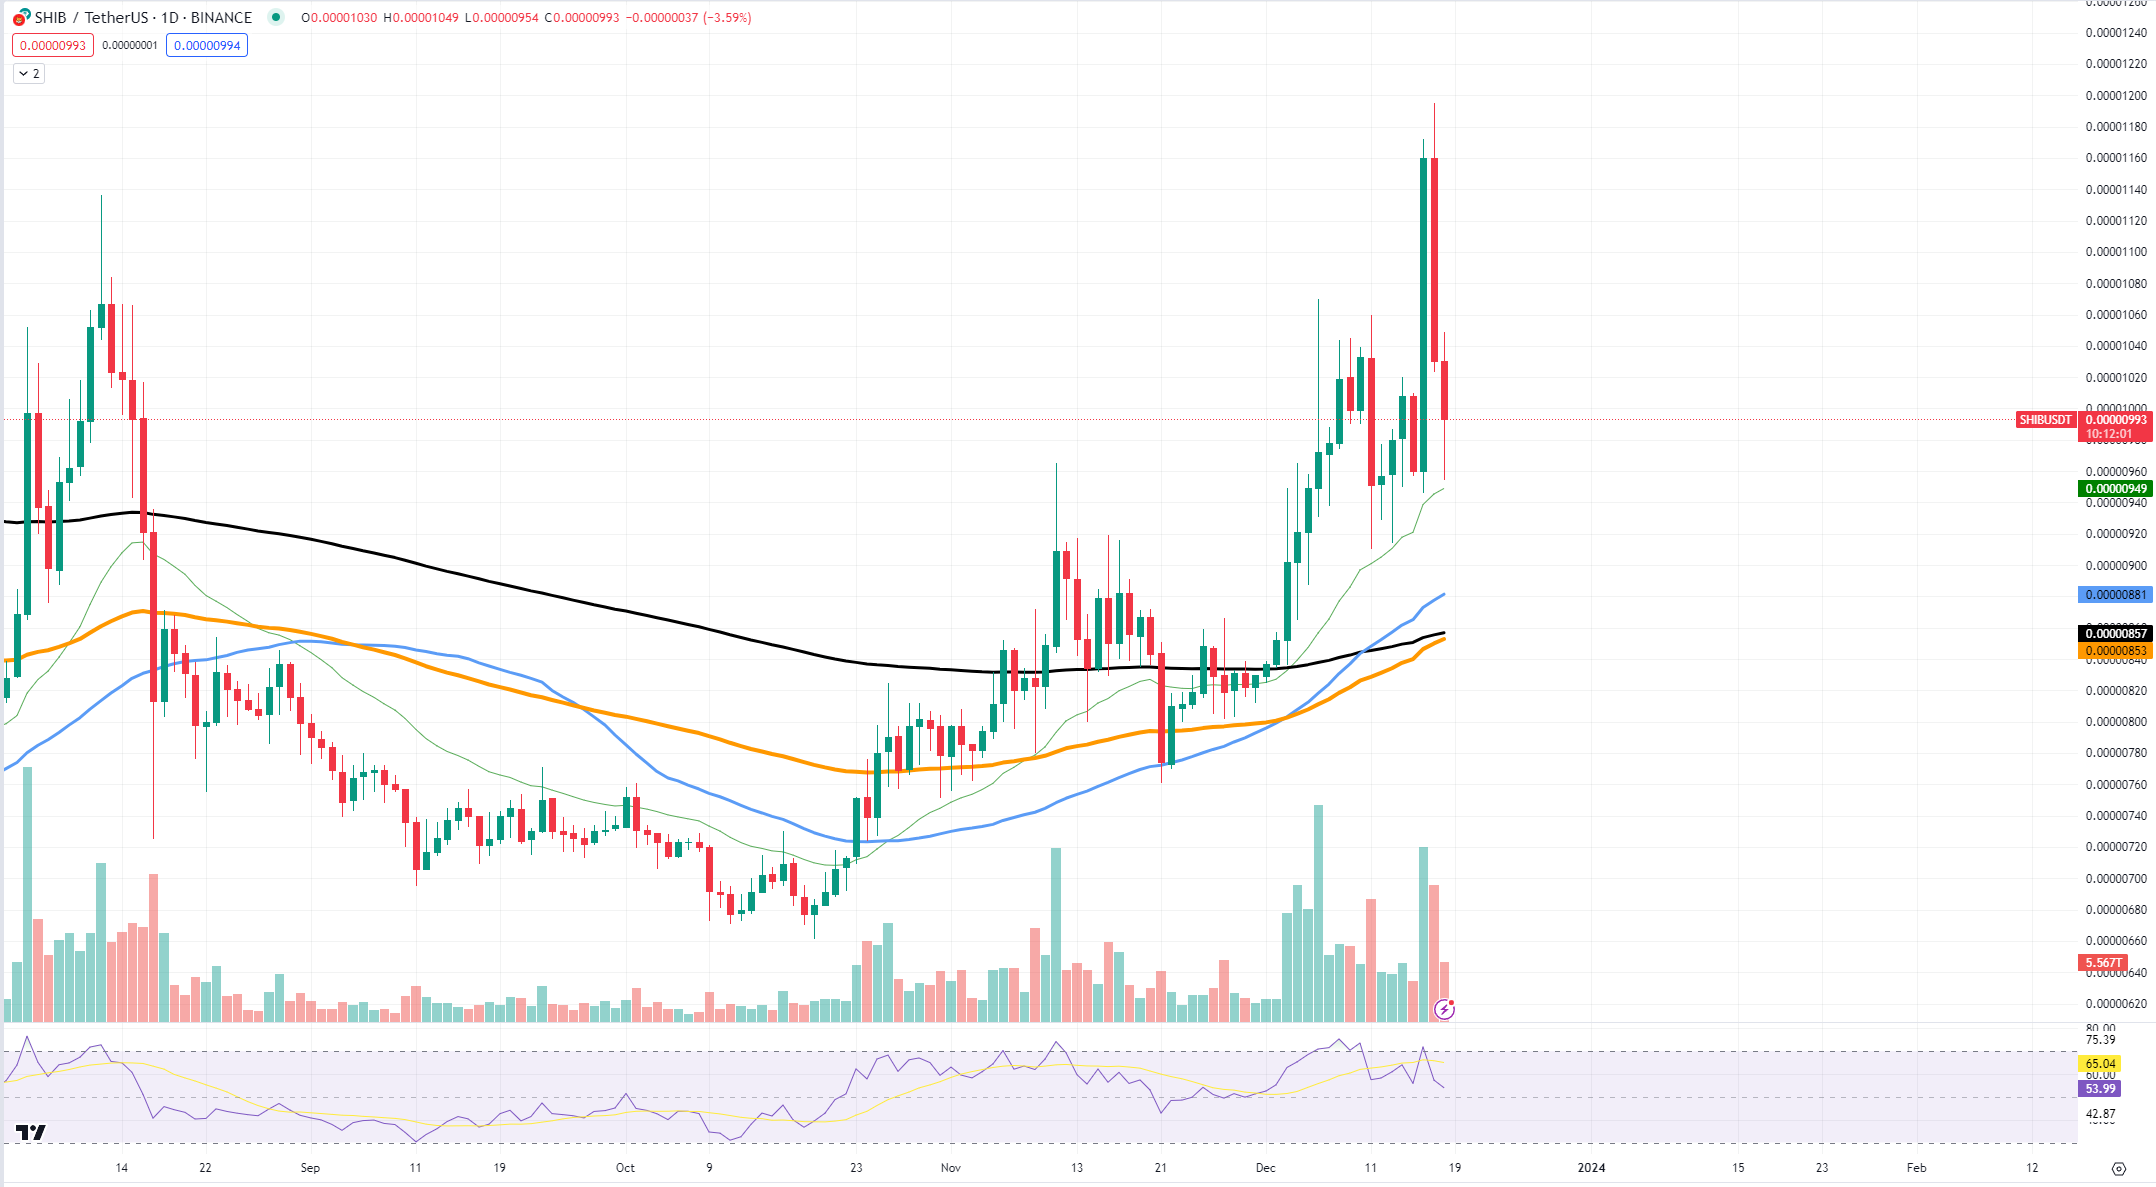
The "death candle" presents a grim outlook for SHIB, as it could signal the end of the rally that meme coin enthusiasts have been riding. The sharp drop in price not only shakes out weak hands but also undermines confidence in the asset's immediate future. With the market appearing to brace for a correction, SHIB may be facing a downturn that could erase a significant portion of its recent gains.
Current market conditions for SHIB seem to be a textbook setup for a substantial correction. The trading volume accompanying the downturn suggests a strong market consensus leaning toward the bearish side. Additionally, the Relative Strength Index, a momentum indicator, has likely retreated from higher levels, confirming the reduced buying pressure and increasing the likelihood of a downtrend.
Cardano needs a hand
After a period of robust growth, Cardano has begun to lose momentum, prompting concerns about its ability to sustain the rally.
The price performance of ADA has shown signs of pressure. The ascent that once placed ADA among the frontrunners in the market cap race is showing fatigue. With each price surge seemingly weaker than the last, the rally's steam is dissipating. The recent price chart reflects this, with a notable dip that has captured the attention of investors.

Technical analysis suggests that ADA has been gradually losing its upward thrust. This is evident from the decreasing trading volume and the Relative Strength Index (RSI) retreating from overbought levels, signaling a potential reversal in the trend. A break of amplitude in technical terms refers to the price movement breaching a significant range of trading. For ADA, this could mean breaking below a support level that has historically held strong, which might precipitate further declines as sell-offs are triggered.
Such a break could be interpreted as a bearish signal, indicating that the market is losing confidence in ADA's immediate prospects. A breach of this nature often leads to a change in investor sentiment, from bullish to bearish, causing a potential shift in a longer-term market dynamic.
XRP's anemic performance
On the ever-volatile crypto markets, Ripple's XRP presents a curious case of tranquility amid turbulence. Recent price movements have shown a perplexing lack of volatility, leaving investors and analysts questioning whether a breakthrough or breakdown is on the horizon for this seasoned digital asset.
The XRP chart exhibits a challenging technical landscape. The price appears to be compressing, coiling tightly between key support and resistance levels. The local support, discernible from the chart, sits near the $0.56 mark. This level has historically served as a psychological and technical foundation, providing a springboard for rebounds. On the flip side, the resistance looms around the $0.63 area, a ceiling that has proven difficult to breach in recent sessions.
This compression of price action is often a precursor to significant moves, as a breakout or breakdown tends to follow periods of consolidation. However, the lack of volatility in XRP's case raises questions about the driving forces behind this market behavior.
 Dan Burgin
 U.Today Editorial Team