Disclaimer: The opinions expressed by our writers are their own and do not represent the views of U.Today. The financial and market information provided on U.Today is intended for informational purposes only. U.Today is not liable for any financial losses incurred while trading cryptocurrencies. Conduct your own research by contacting financial experts before making any investment decisions. We believe that all content is accurate as of the date of publication, but certain offers mentioned may no longer be available.
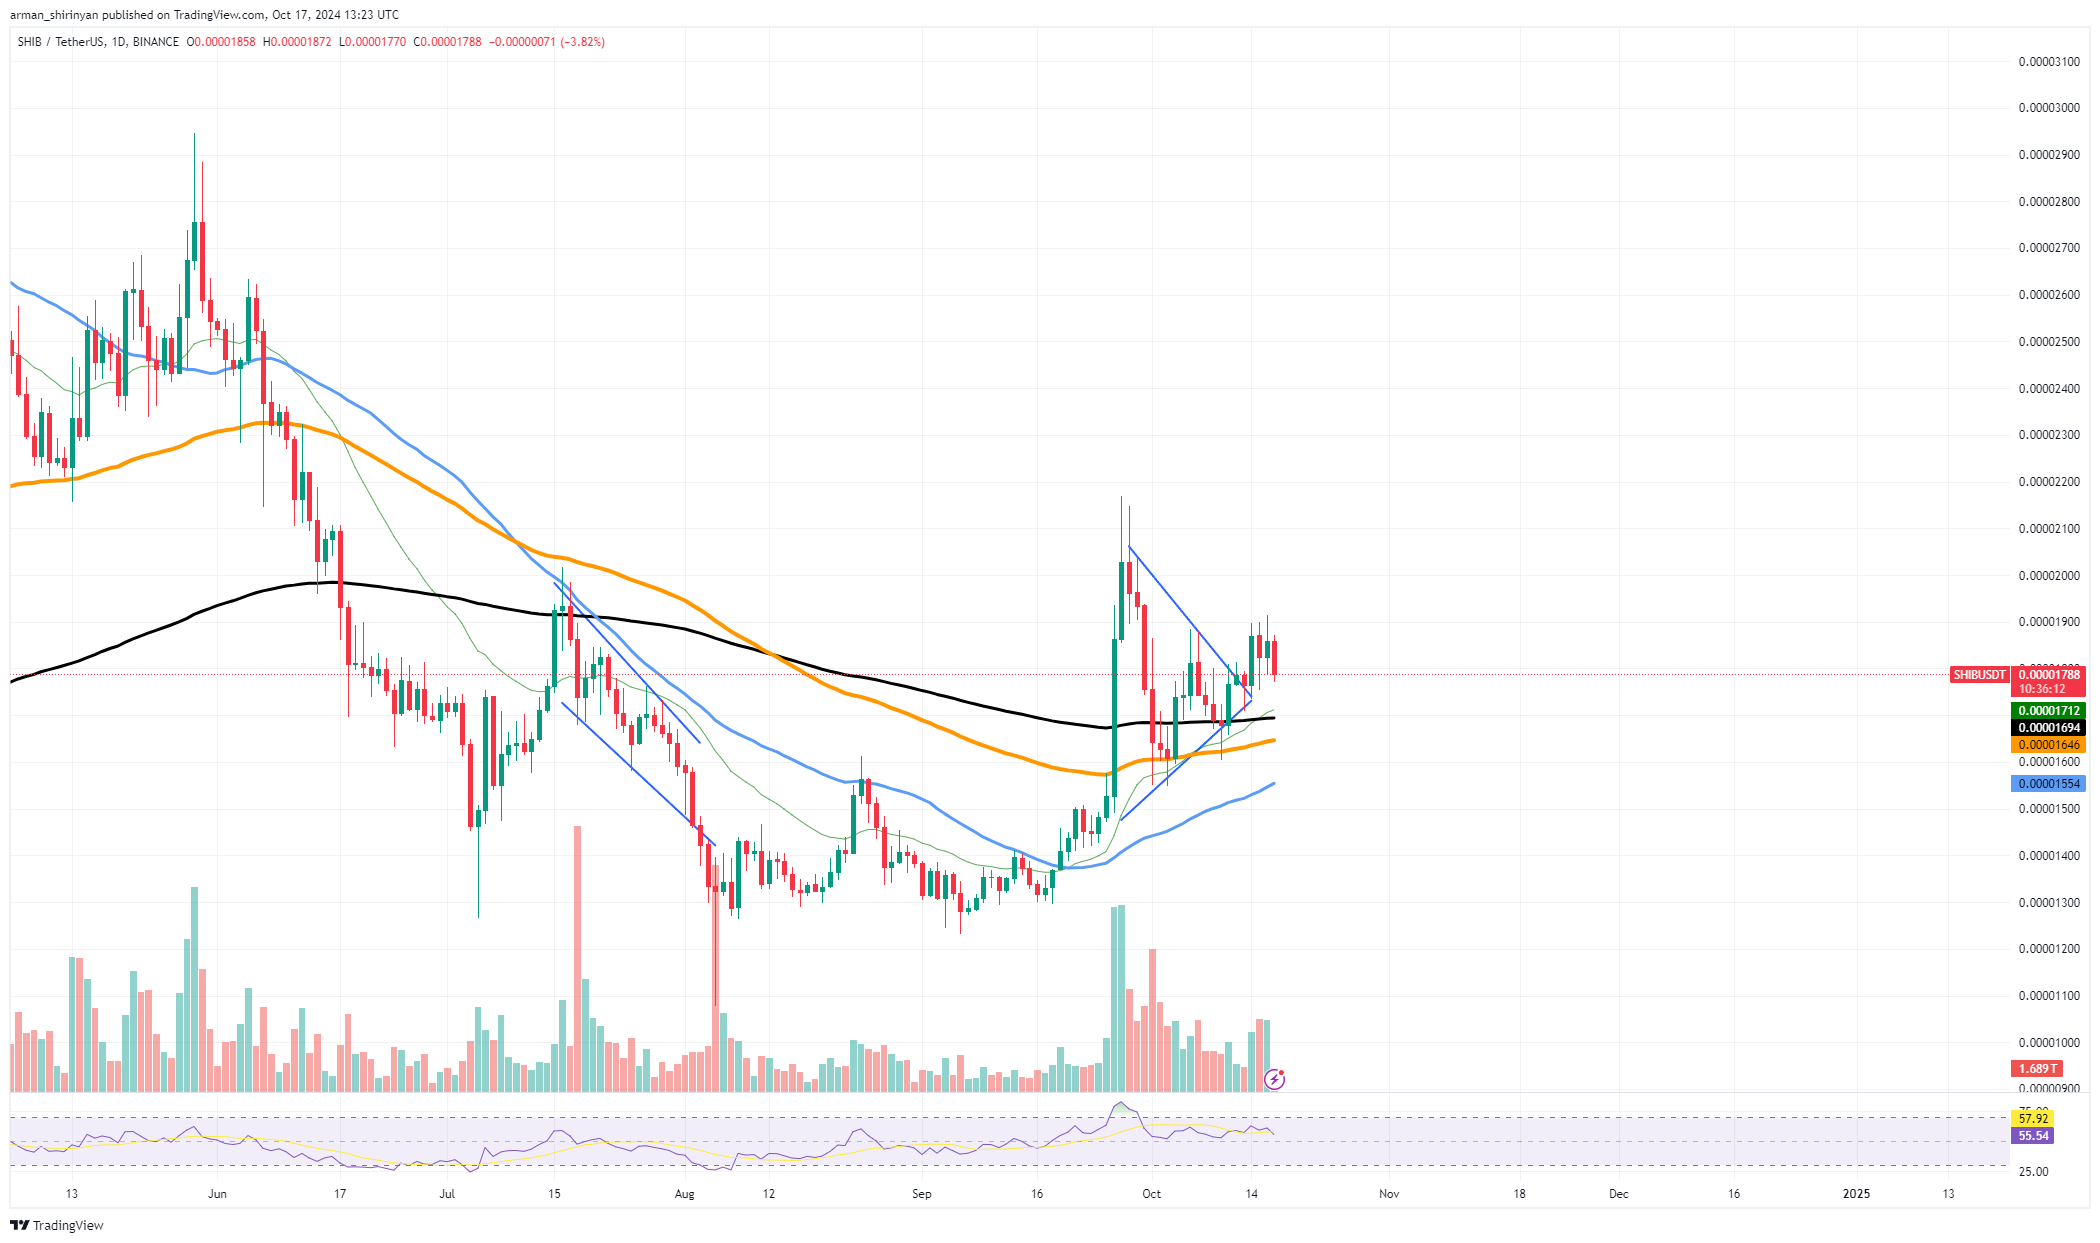
As it gets closer to forming a golden cross, Shiba Inu is exhibiting indicators of a possible breakout. The 50-day moving average crossing above the 200-day moving average is a bullish pattern that frequently results in a substantial increase in market momentum. SHIB has been rising steadily from its recent lows, and if the golden cross occurs, the market might soon recover, paving the way for a spike.
We might witness a sharp increase in price movement if Shiba Inu is able to form a golden cross. Golden crosses have historically been used to indicate the start of a long-term uptrend and draw additional buying pressure from traders and investors. SHIB may surpass resistance levels, with $0.00002000 as its initial target. In the event that traders take advantage of the strong bullish signal, the price may rise further toward $0.00002500 and beyond.

This could also help revive interest in the meme coin given the mood of the market, which could lead to a surge. Conversely, a situation exists in which SHIB misses the golden cross. It may be difficult for SHIB to break higher if the 50-day moving average loses traction or if there is a wider market decline.
In this scenario, the price may retreat to important support levels at or below $0.00001500, which would resume consolidation and halt any bullish moves. Traders can predict SHIB's future direction by keeping an eye on these price levels and the general state of the market while it waits for this critical signal.
Solana's problematic state
Based on its potential double-top pattern, a bearish formation that suggests a potential reversal, Solana seems to be at a critical juncture. When an asset reaches its peak price twice but is unable to break above it, a pattern like this develops. If SOL loses momentum, the double-top pattern might be problematic, which would worry traders and investors.
Solana's critical support is currently at $141, and this could have a major impact on how much the stock moves in the future. A break up of the double-top pattern could signal a more severe decline if SOL drops below this level. The next support in this scenario would be at or near $130, where SOL might try to find a bottom.
The asset may enter a protracted downtrend if these levels are not maintained. To invalidate the double-top formation, Solana must break through $160 on the upside.
While the present pessimistic attitude persists, Solana may find it difficult to sustain any meaningful upswing. Solana's robust ecosystem and widespread adoption mean that, even with the current bearish setup, it still has strong potential going forward. Users and developers are drawn to the project because of its capacity to manage large volumes of data at rapid speeds. SOL's long-term fundamentals are still favorable despite the uncertain short-term outlook.
Ethereum's substantial resistance
The price direction of Ethereum in the near future may be determined by the level of resistance it is currently facing. An important barrier preventing ETH from launching into a more robust uptrend is the 100 EMA. Ethereum has struggled with this technical level, and price action has frequently stalled below it.
The difficulty is exacerbated by Ethereum's recent downward volume trend. The asset may find it even harder to overcome resistance if there is low volume, which usually indicates a lack of buying interest. Because of this decreased activity, ETH is more susceptible to a possible reversal should it be unable to build sufficient momentum. Ethereum will encounter resistance in the near future at the $2,700 mark, which corresponds to the 100 EMA.
It could pave the way for a stronger rally and possibly higher price targets if ETH can break through this zone. But if $2,700 is not broken, there may be more consolidation or even a pullback. In spite of these temporary obstacles, Ethereum is still in an upward dynamic, indicating a generally positive trend. With strong fundamentals and ongoing network expansion, the asset's long-term prospects remain favorable.
Ethereum may return to a robust uptrend and restore bullish sentiment if it can clear the 100 EMA and the $2,700 resistance. The decreasing volume, though, is still an issue. For Ethereum to maintain momentum and break the resistance decisively, there must be a spike in buying volume.


 Alex Dovbnya
 Gamza Khanzadaev
 Yuri Molchan
 Tomiwabold Olajide
 Arman Shirinyan