Monero was initially launched in April 2014 as a fork of Bytecoin, under the name BitMonero. Ever since its inception the coin has been focused on anonymity, private transactions, and decentralization. Monero’s trading symbol is XMR, it uses the proof-of-work algorithm CryptoNight and is designed to be ASIC resistant (good news for small miners).
The protocol uses an obfuscated public ledger and Ring Signatures which mix the sender’s transactions with a group of others. This system makes it more difficult to establish links between sender/receive thus providing anonymity for users. Further, the use of “stealth addresses” makes it impossible for third parties to discover the actual destination address which is known only to the sender and receiver.
Mainly due to its privacy-oriented nature, Monero became the cryptocurrency of choice for dark markets users. In the first half of 2018, it was used in 44% of crypto-related ransomware attacks which is a concern for traders and HODL’ers.
XMR/USD Technical Outlook – The Big Picture
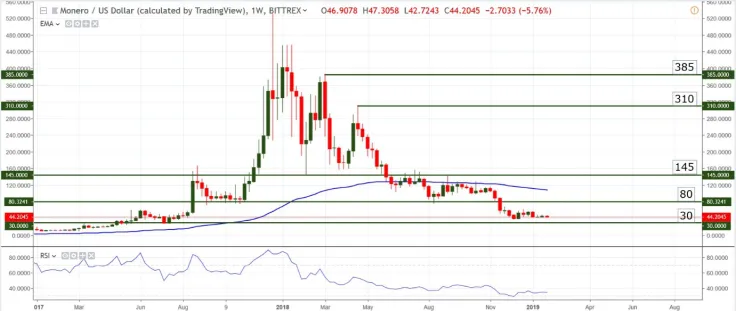
Currently trading around $43 Monero reached its highest price in early January 2018 when one XMR was worth 496 US Dollars. The privacy coin is now sitting at the 13th spot in market cap rankings with a total supply worth just over $731 million.
Similar to almost all other cryptocurrencies in the top 20, Monero (XMR) reached a top in early January 2018 and has been falling ever since. The pair has been printing lower lows and lower highs for the entirety of 2018 which is a staple of bearish trends. This one doesn’t show clear signs of coming to an end.

Between June and November 2018, the price of XMR was trading inside the horizontal channel created by 145 resistance and 80 support. It has since exited said channel and is approaching the long-term support at 30 which I consider to be the next target on a weekly chart.
The Relative Strength Index has been crawling at the bottom of its range since the beginning of December, but it is not clearly oversold so the only argument for retracement higher remains the fact that the downtrend seems to be losing steam. However, that alone is not enough indication that prices will rise in the near future.

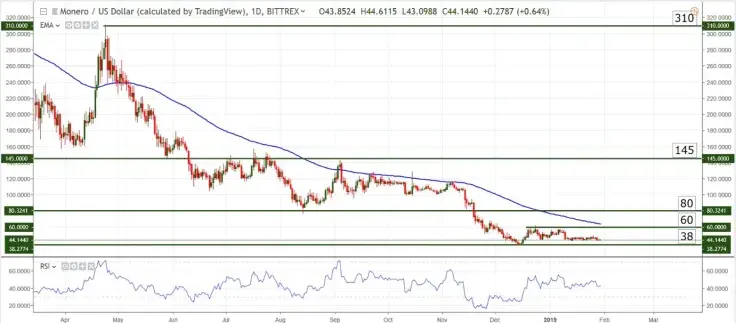
On a Daily chart, we can see the same clear downtrend with the pair below the 100 days Exponential Moving Average and lower lows printed on a constant basis. Daily support sits at 38, resistance at 60 and the latest price action is flat, which makes it hard to anticipate the next short-to-medium term direction. However, from a long-term perspective, the pair is headed south so we expect to see a break of 38 followed by a move into 30 and possibly lower.
Daily Chart Support: 38 (the exact price differs depending on exchange)
Weekly Chart Support: 30
Daily Chart Resistance: 60, 100 days EMA and 80
Weekly Chart Resistance: 80, 145, 310
Most likely scenario: continuation of the downtrend, move below support
Alternate scenario: extended sideways price action, possible moves up based on downtrend exhaustion; keep in mind these are technical scenarios, which can be invalidated by fundamental developments
 Vladislav Sopov
 Dan Burgin