
On March 7, the jackals ripped the market open with razor-sharp teeth and bought whatever was on offer at 75-day record volumes (for the 4H timeframe).
These events transpired when the news broke about the Binance exchange hack. At first there were no details, and when it turned out that all the money was safe, the market had already tumbled down by 10-15 percent. But amidst the bacchanalia, I observed one elegant pattern that allowed me to enjoy very sound sleep and made evident that what happened was just an quick purchases by the hands of a frightened crowd.
Minute timeframes
I will begin with the fact that in technical analysis, I examine every timeframe, from the minute to the week. When there is a battle for a certain level or some kind of emotional movement, I deeply enjoy looking at the price movements within the minutes. That way, you can see the subtlest signs of the market and understand what exactly takes place on the battlefield.
Imagine my surprise when on the minute chart I saw a fractal duplicating the structure of a higher order! So, what is this structure like?
Fractal history repeating
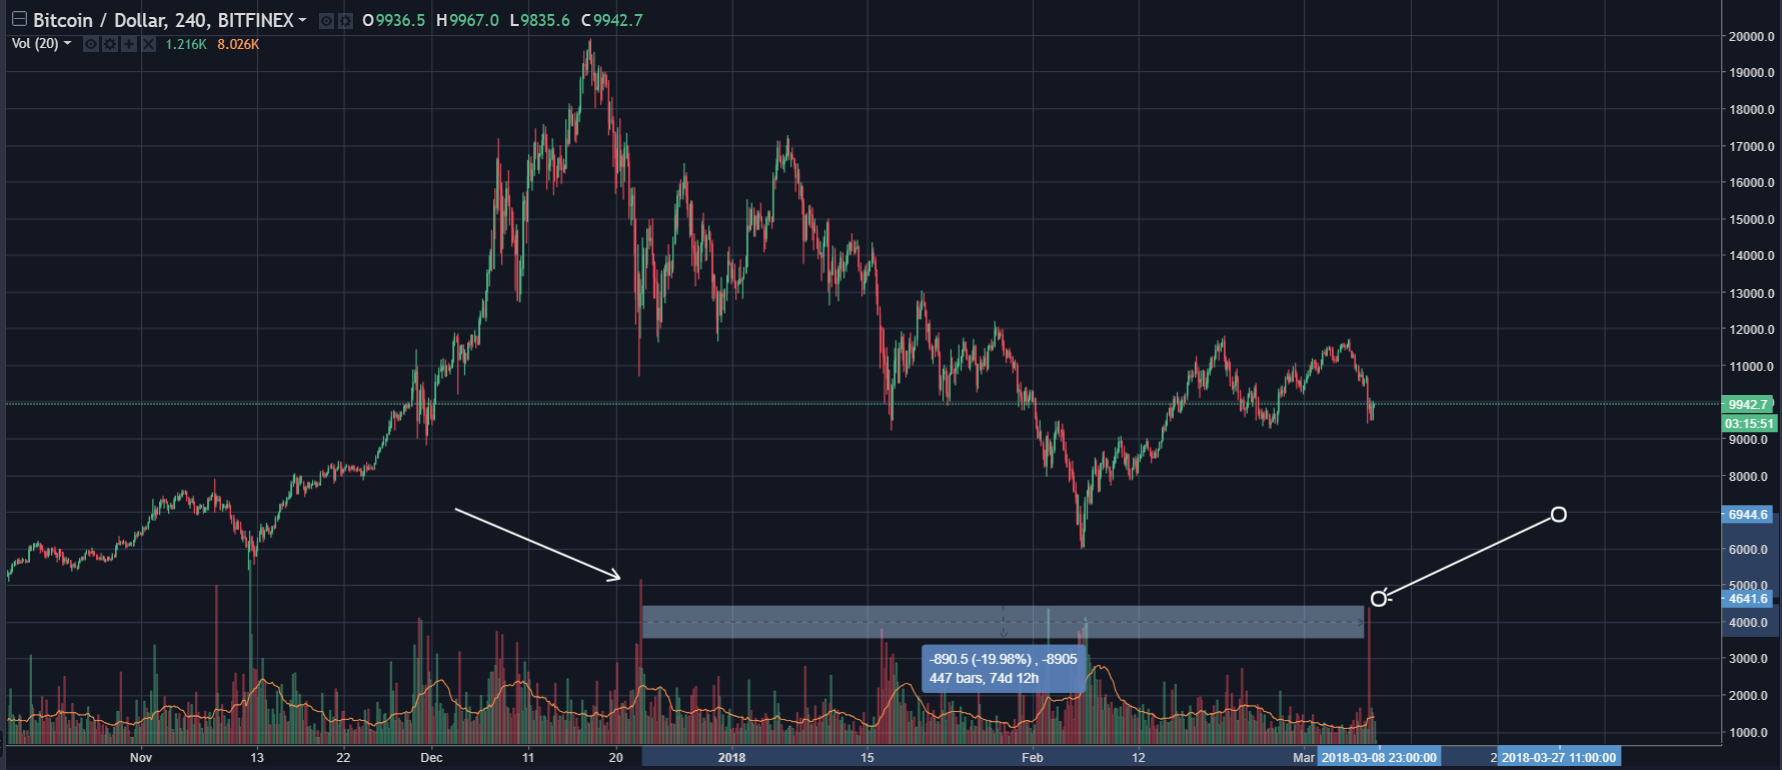
The trek down to $6,000 is still fresh in our memories — at that point, I was looking at the events very carefully and observed an important detail. A large volume was coming directly onto the crowd. This happens occasionally… “Smart” money starts to come in a little before the decline targets, at the same time creating a trap for the buyers and attracting additional volumes. Then, the price is passed around this “trial” run, and met at the next level. Naturally, as a result the price is directed far above the “trial” entry and the costs of the initiative are paid off.
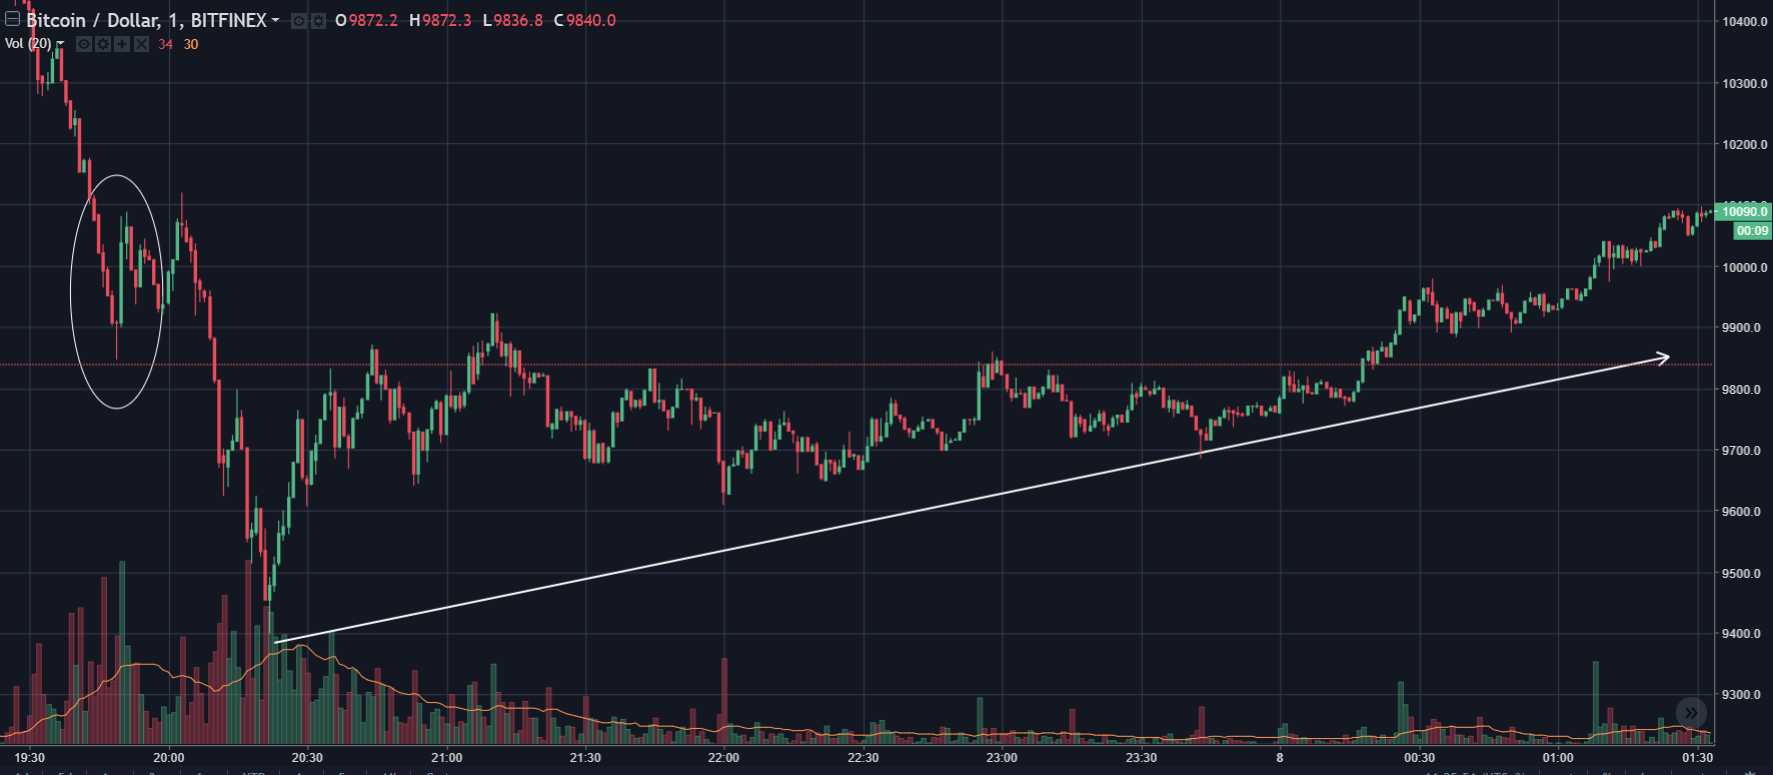
So, in the minute intervals I saw a painfully familiar picture. It was a small duplicate scenario of the decline to $6,000. I hurriedly took a couple of screenshots, such that I couldn’t be accused of falsifying the facts. Take a look for yourselves…
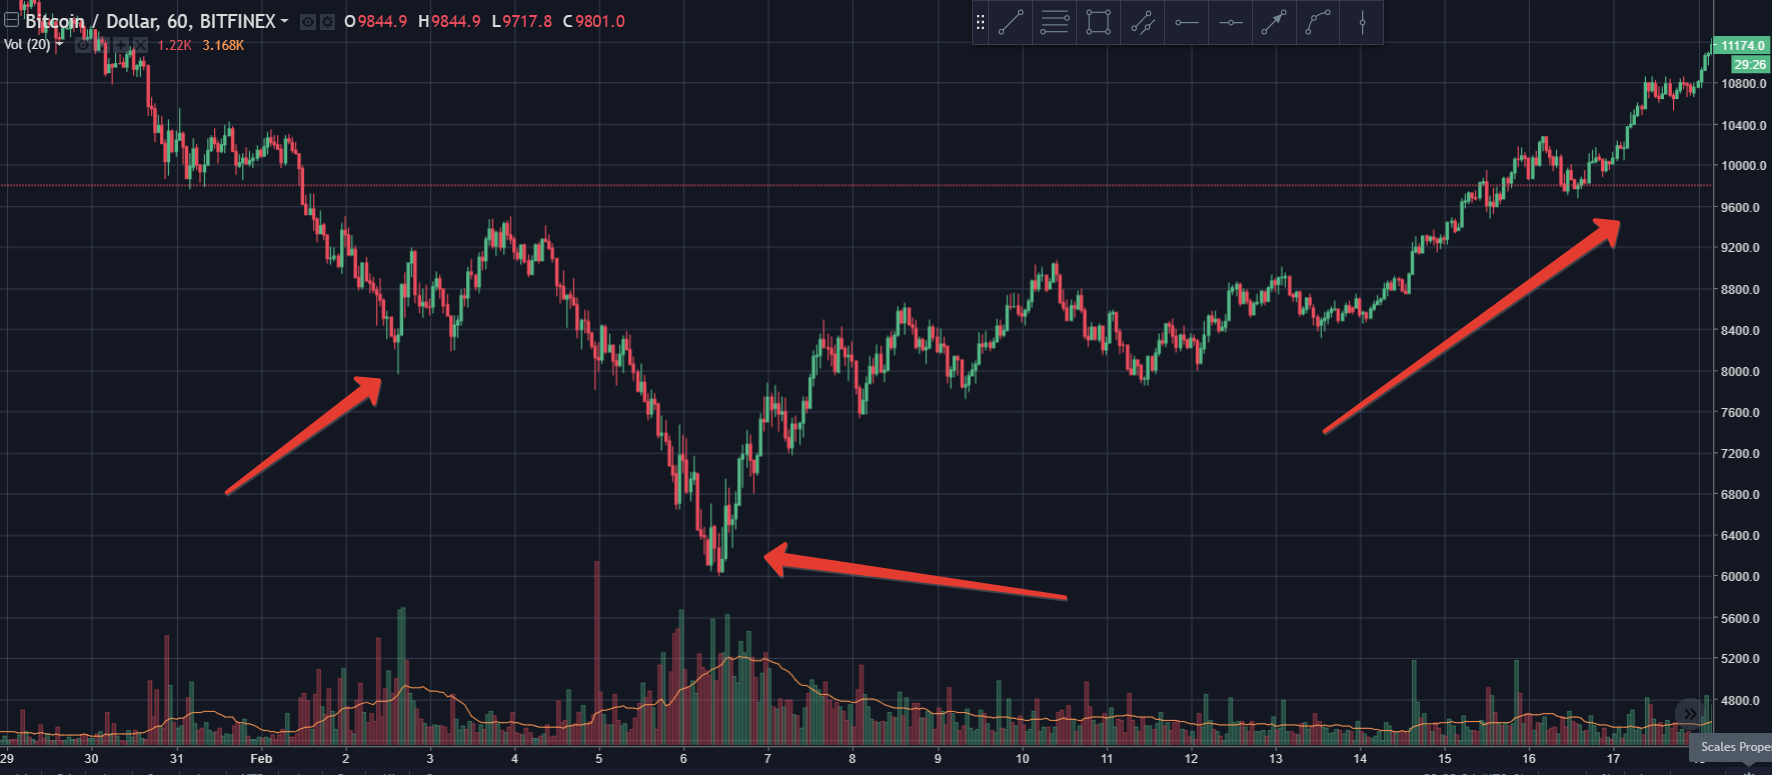
The hourly chart.
The minutes.
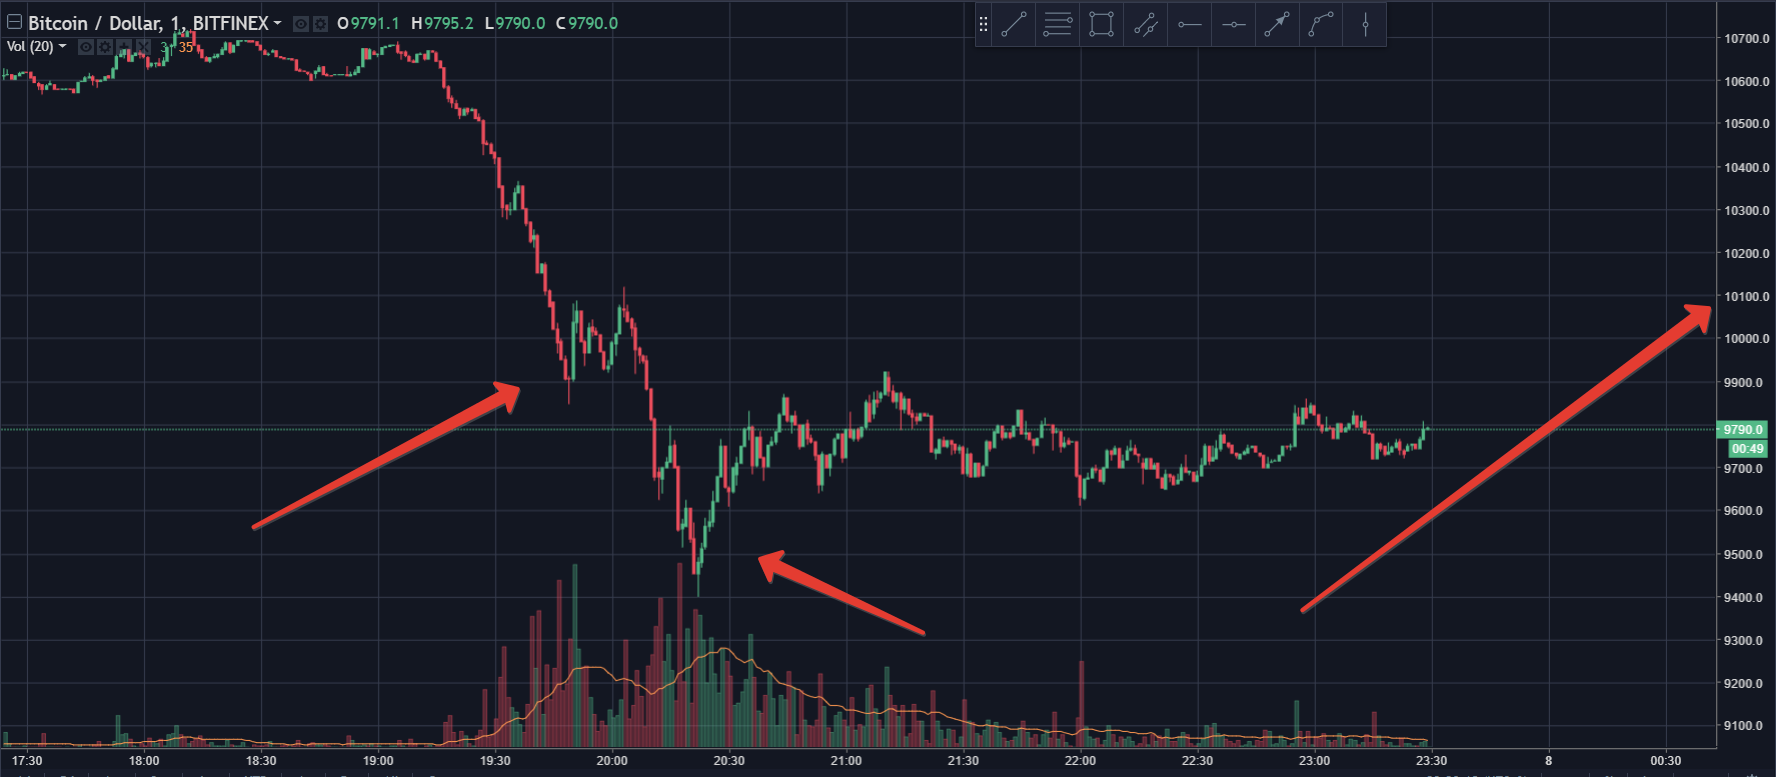
As a result of the trades, the fractal truly repeated itself with minor errors!
The hourly chart.
The minutes.
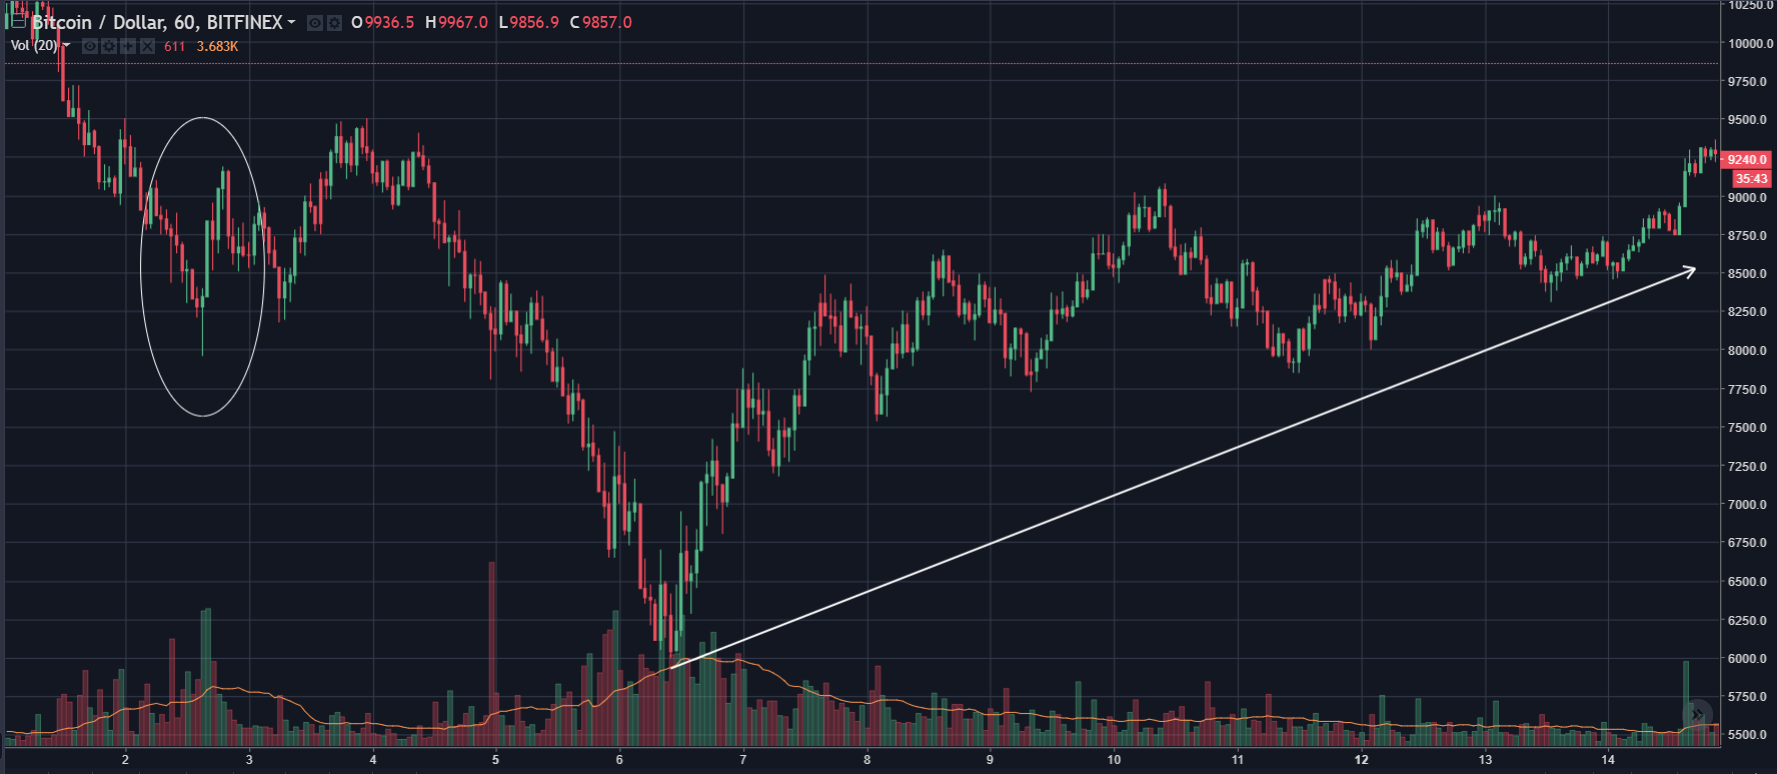
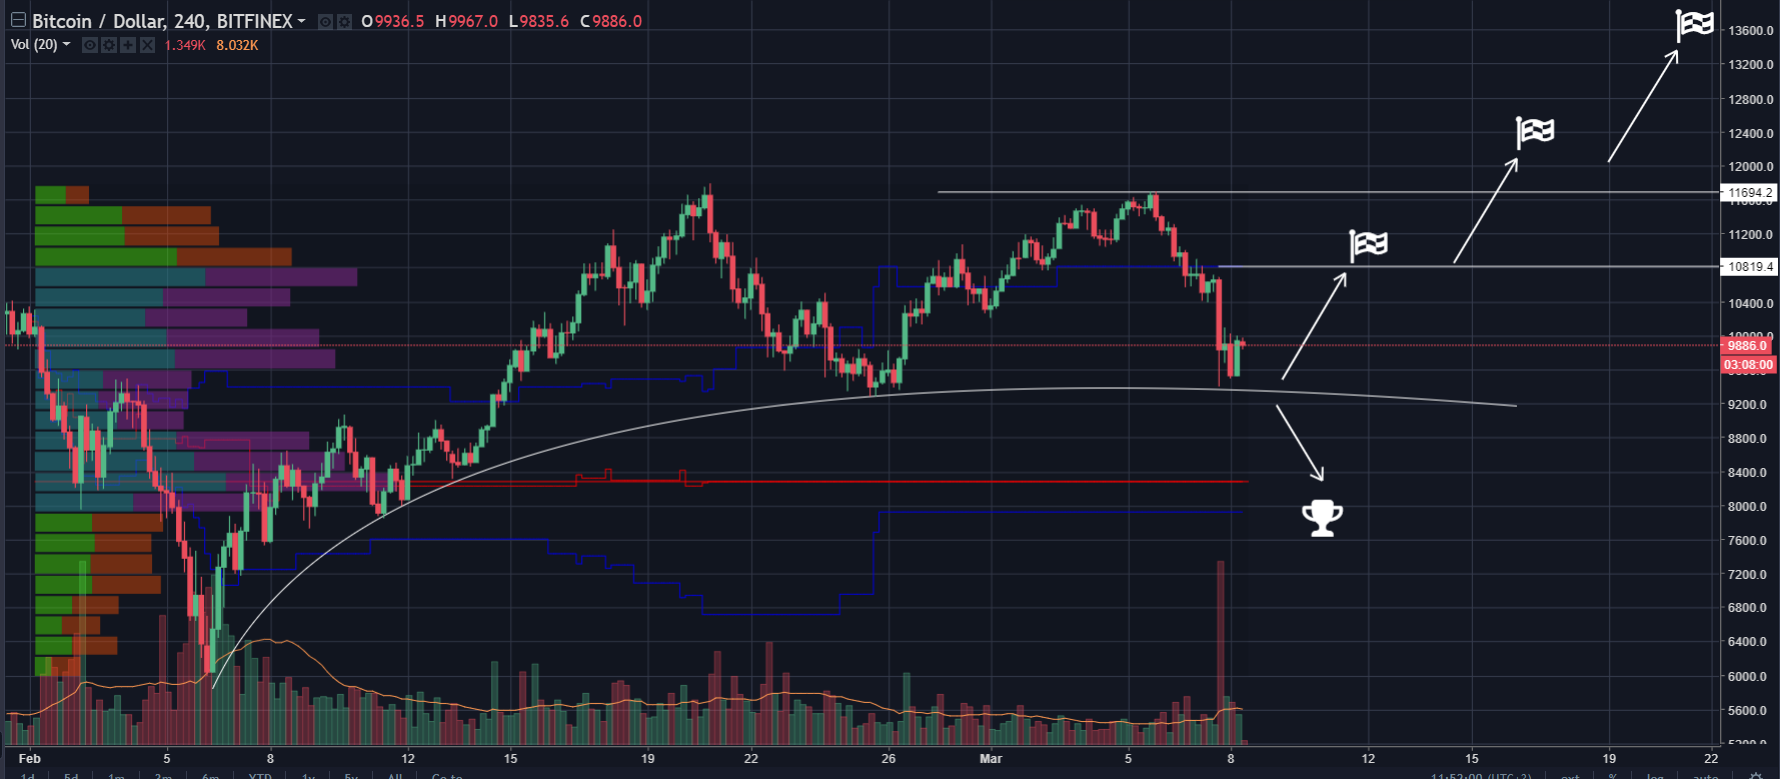
Further on, the fractal forms begin to dissipate and we move to a new logic. At the same time, I see the following probabilities for the recovery scenario: a return to the level of fair price — $10,800 — on March 8 by 10.55 p.m., on March 9 by 8.55 a.m. or 7.35 p.m. (all times given in UTC + 3).
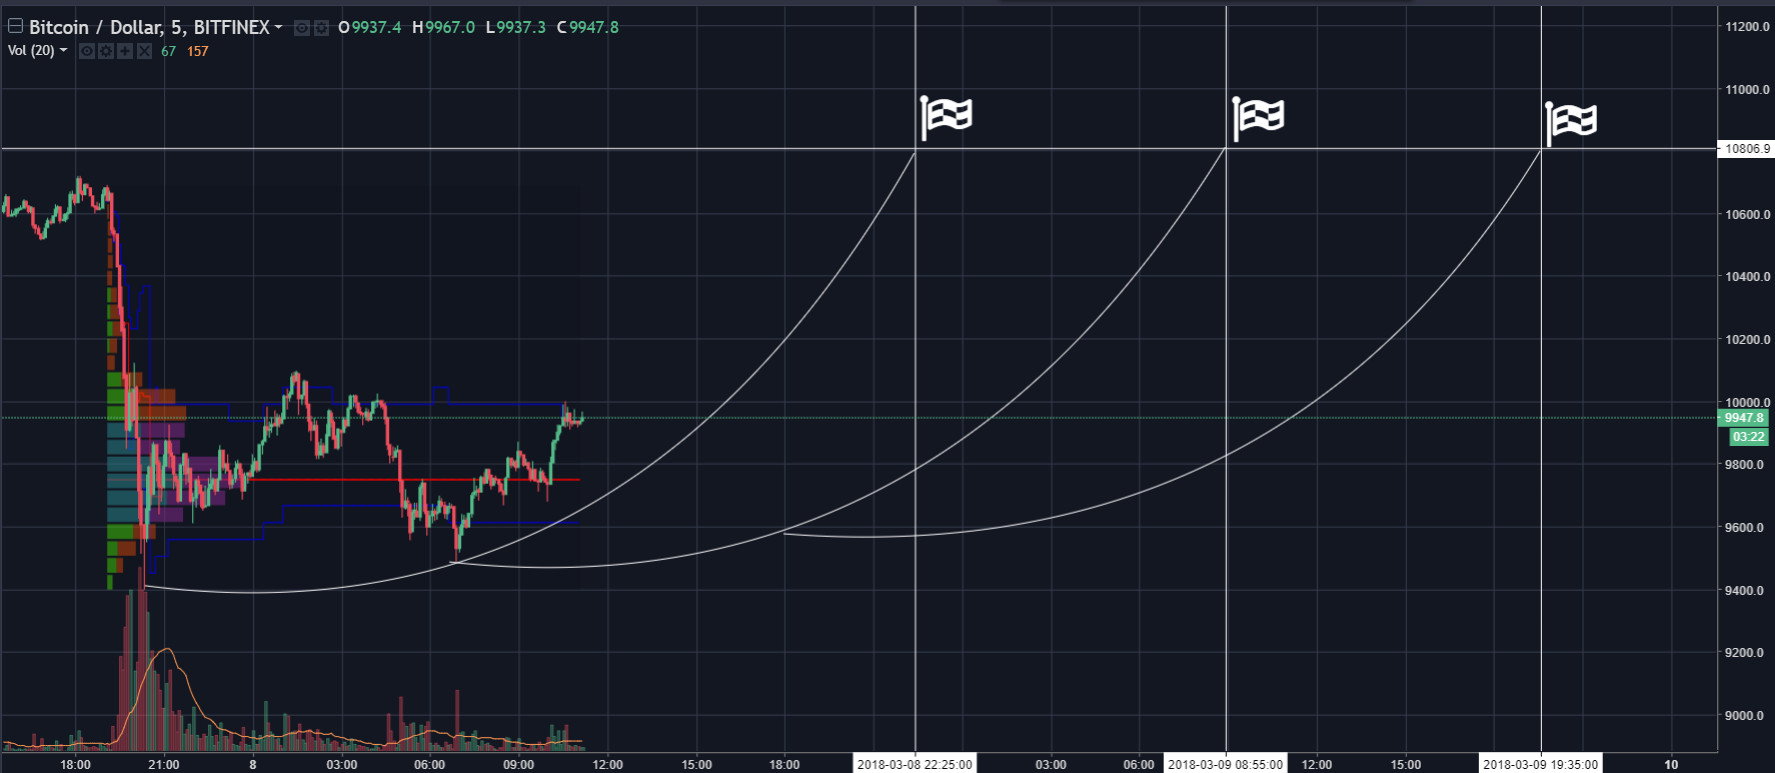
Meanwhile, be vigilant and do not forget about the support at the $9,400 level. If it is broken, we can expect a continued decline by 10-12 percent.
As always, wishing you successful trades!
 Dan Burgin
 U.Today Editorial Team