
Disclaimer: The opinions expressed by our writers are their own and do not represent the views of U.Today. The financial and market information provided on U.Today is intended for informational purposes only. U.Today is not liable for any financial losses incurred while trading cryptocurrencies. Conduct your own research by contacting financial experts before making any investment decisions. We believe that all content is accurate as of the date of publication, but certain offers mentioned may no longer be available.
Cardano is currently navigating through turbulent market conditions. As the broader cryptocurrency market experiences a downturn, ADA has reached a psychologically significant price level at $0.5, which could be a decisive factor for its short-term price trajectory.
The $0.5 mark for Cardano is not just another number on the price chart; it represents a major psychological support level that often triggers emotional trading decisions. Historically, such levels can lead to increased buying activity as traders view them as opportunities for entry, while others may see them as a moment to Cut their losses, leading to increased selling pressure.
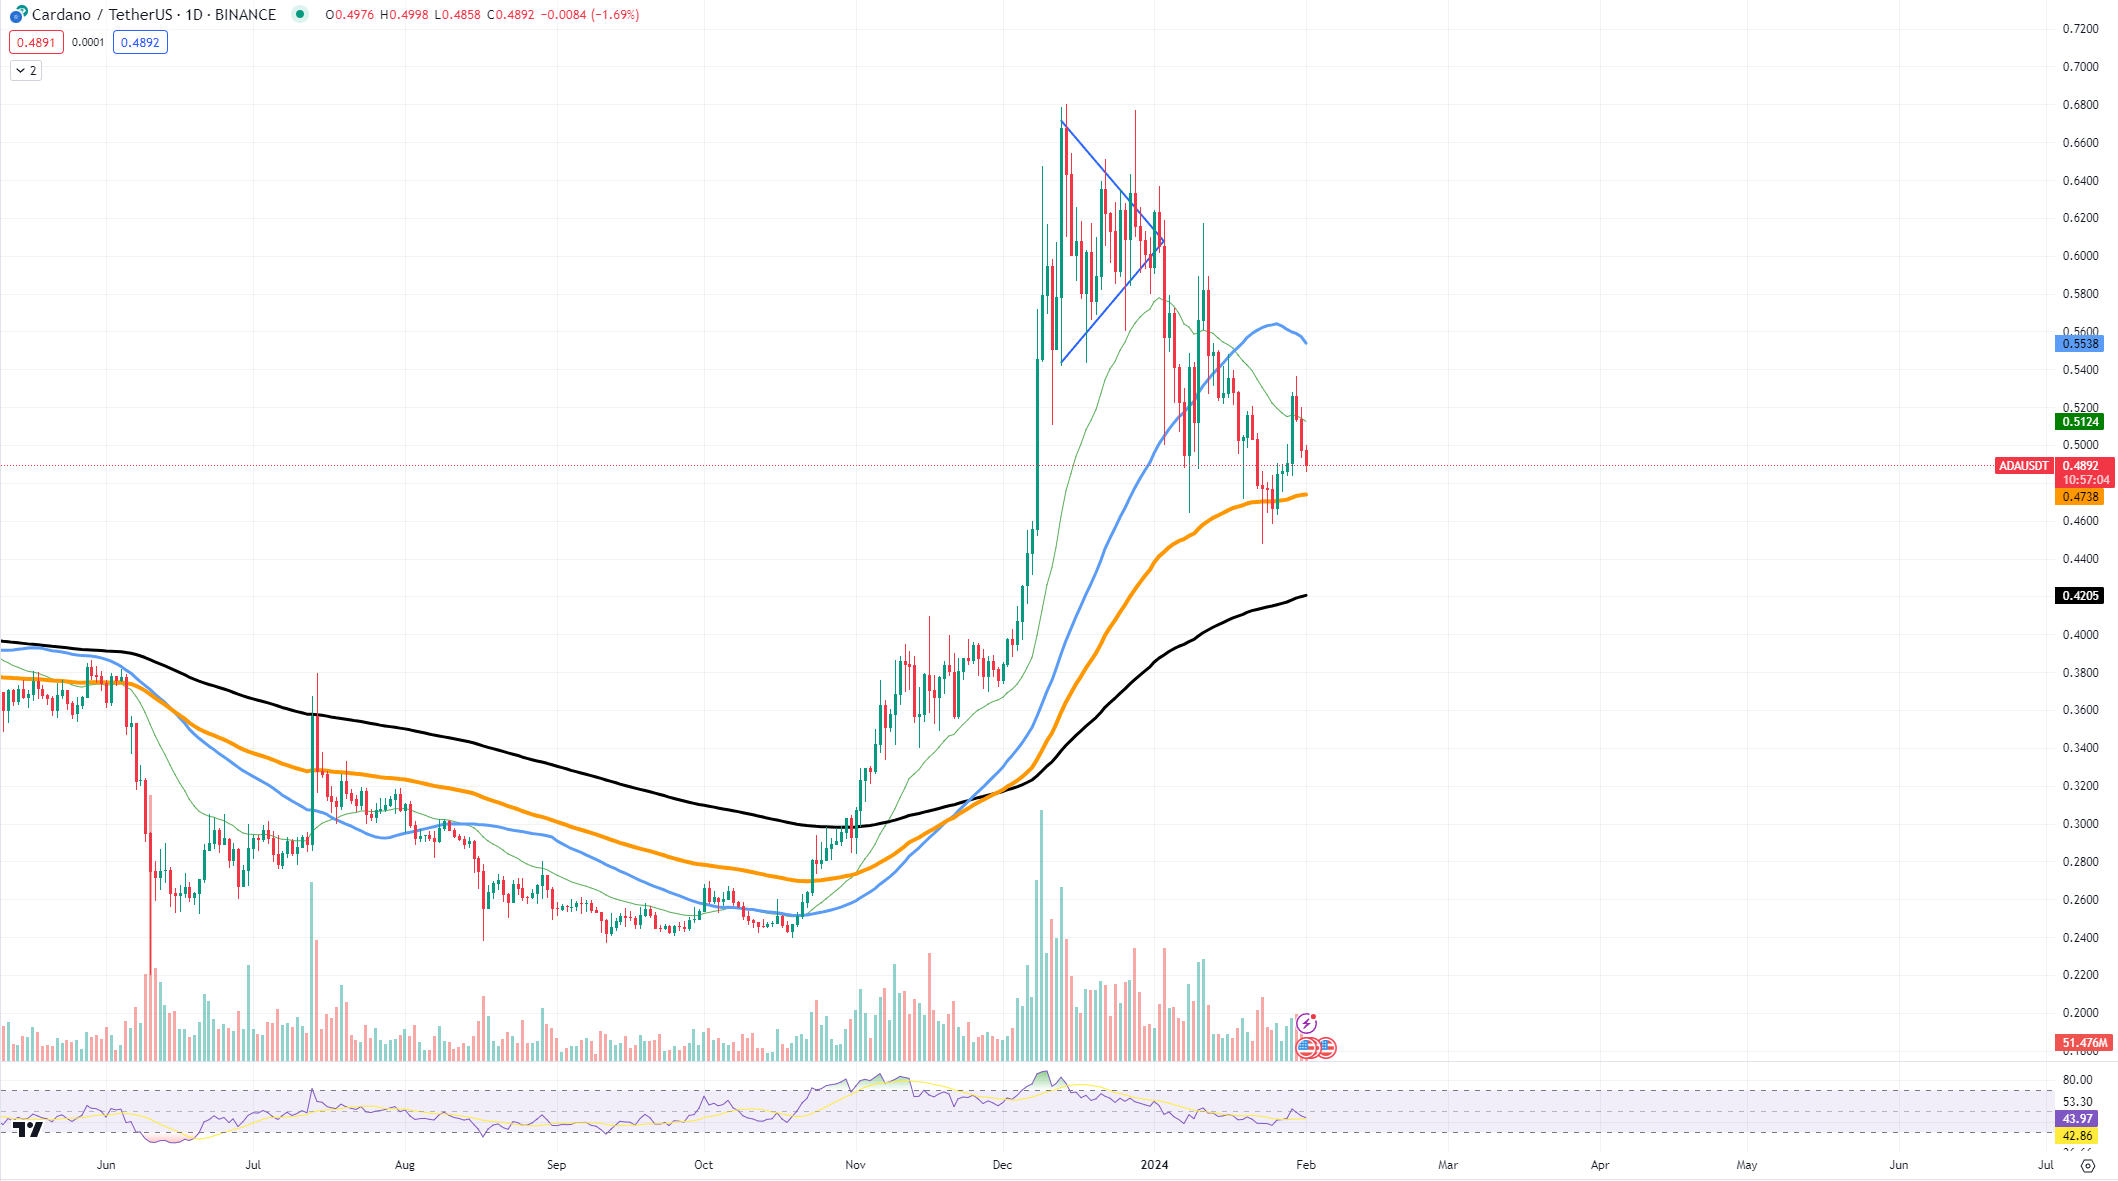
ADA has shown signs of retracement, approaching this critical half-dollar value. The price action around this level is worth monitoring closely, as a convincing bounce could signal a potential reversal and a test of upper resistance levels. The immediate resistance level to watch is $0.59, a breach of which could propel ADA toward more robust resistance near $0.63.
Conversely, if the $0.5 support fails to hold, the downside risk could see Cardano aiming for the next support at $0.4738. If this level does not sustain the selling pressure, the door may open to further declines, with a possible fall toward the $0.42 region, which could act as a last stand for buyers to defend.
Reversal near for Shiba Inu
Shiba Inu presents a potential turning point at a critical support level. The meme coin now hints at a possible inverse double bottom pattern, suggesting a reversal might almost be here.
The SHIB price chart indicates that it is currently testing a support level around $0.0000089. This price point is crucial as it has previously acted as a strong psychological and technical barrier, halting further declines and prompting upward moves. If SHIB maintains above this level, it could confirm the pattern's completion and indicate the start of a bullish phase.

An inverse double bottom is a common bullish reversal pattern that signals the exhaustion of a downtrend and the commencement of an upward trajectory. For SHIB, maintaining the support at $0.0000089 is paramount.
If SHIB successfully leverages the current support, we could see it target the next resistance near $0.000010, a level that has previously seen significant trading activity. Achieving this would represent a notable percentage increase from the support level and could invigorate the market's confidence in the asset.
Furthermore, crossing the $0.000010 threshold could see SHIB aim for a more optimistic target at $0.0000110, which would correspond to the height of the pattern projected upwards. Such a move would not only break the immediate bearish sentiment but also potentially attract new investors looking for confirmation of a trend reversal.
Polygon shows strength
Polygon is touching a significant support level that could dictate its future trajectory. This level, viewed by many traders as a make-or-break point, holds the key to whether MATIC can maintain its ground or succumb to further bearish pressure.
The token's price has nestled at a support zone that has historically been a stronghold for buyers, providing a springboard for potential upward movements. The resilience of this support is evident, with multiple touches over the past weeks, each time resisting a breakdown.

Such a cross would typically signal a long-term bear market on the horizon, but current market conditions, coupled with descending volume, suggest that the bearish momentum is waning rather than intensifying.
The descending volume, alongside the price finding support, may indicate a consolidation phase rather than a continuation of the downtrend. If MATIC manages to sustain this support level and initiate a reversal, it could negate the bearish implications of a death cross and lead to a trend change.
For Polygon, this is more than a mere technical movement; it represents a moment of truth that could either reaffirm investor confidence or test the resolve of holders. Should MATIC rebound from this level, the first target for a bullish scenario would be a retest of the resistance around the $0.8468 mark. A successful breach above this resistance could inject further optimism, possibly propelling the price toward higher resistance levels.
 Dan Burgin
 U.Today Editorial Team