
Disclaimer: The opinions expressed by our writers are their own and do not represent the views of U.Today. The financial and market information provided on U.Today is intended for informational purposes only. U.Today is not liable for any financial losses incurred while trading cryptocurrencies. Conduct your own research by contacting financial experts before making any investment decisions. We believe that all content is accurate as of the date of publication, but certain offers mentioned may no longer be available.
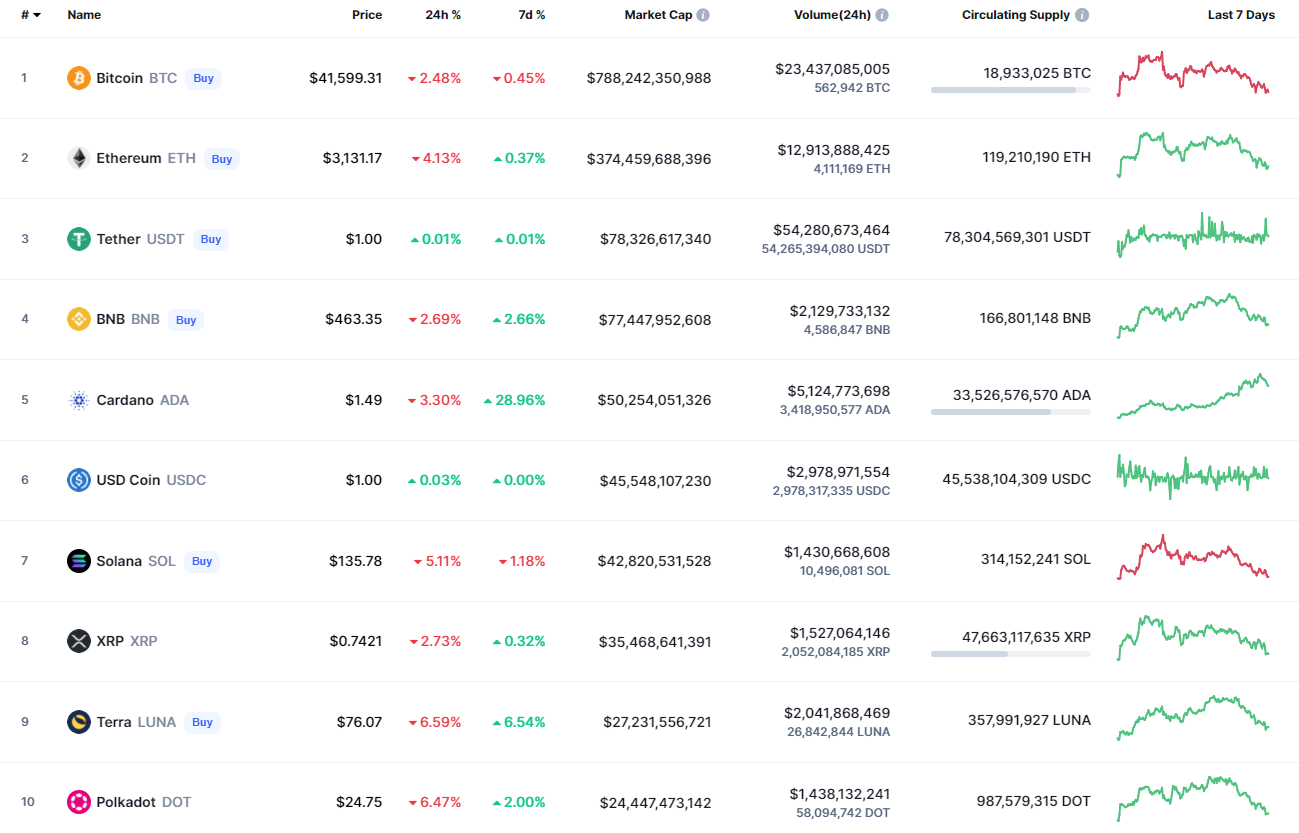
Bears are not going up, with the top 10 largest coins remaining in the red zone.
BTC/USD
Yesterday, sellers pushed the price of Bitcoin below the two-hour EMA55, and they broke through the support at $42,447 in the evening. At the end of the day, an intraday low of $41,580 was reached.
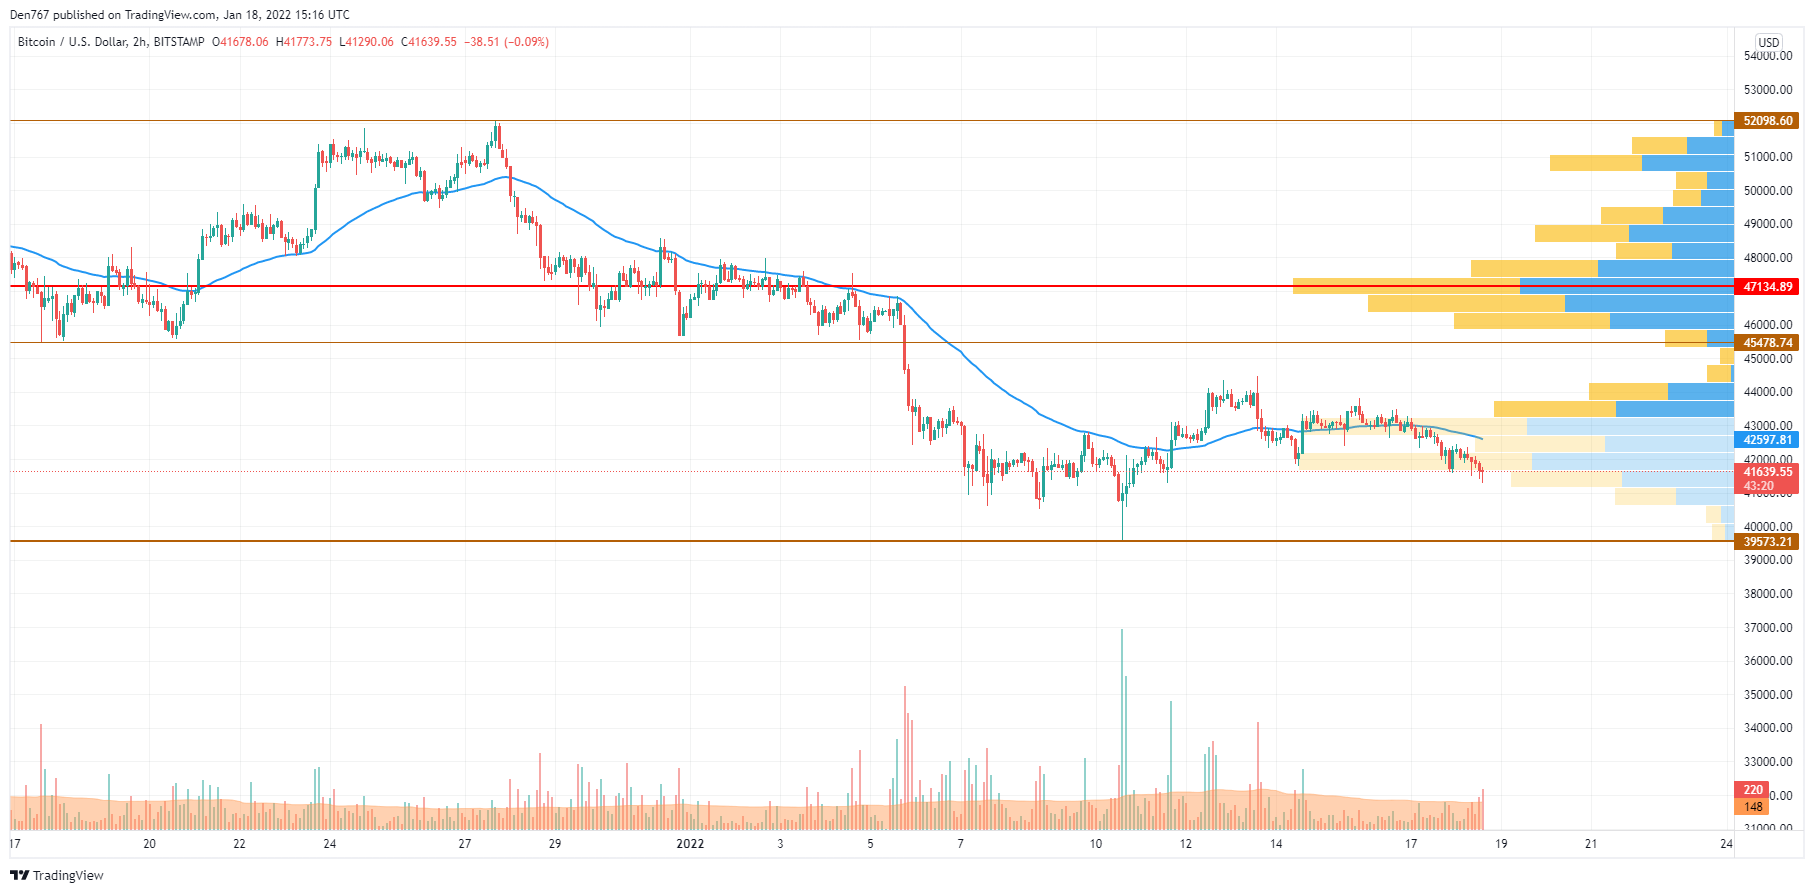
The pair tried to recover overnight, but the 50% Fibonacci level limited the weak growth. Today, the decline may continue to the support of $40,000.
Bitcoin is trading at $41,684 at press time.
XRP/USD
Yesterday, the price of XRP rolled back below the EMA55 moving average, and the pair was no longer able to recover above this level during the day. It is down 2.73% today.
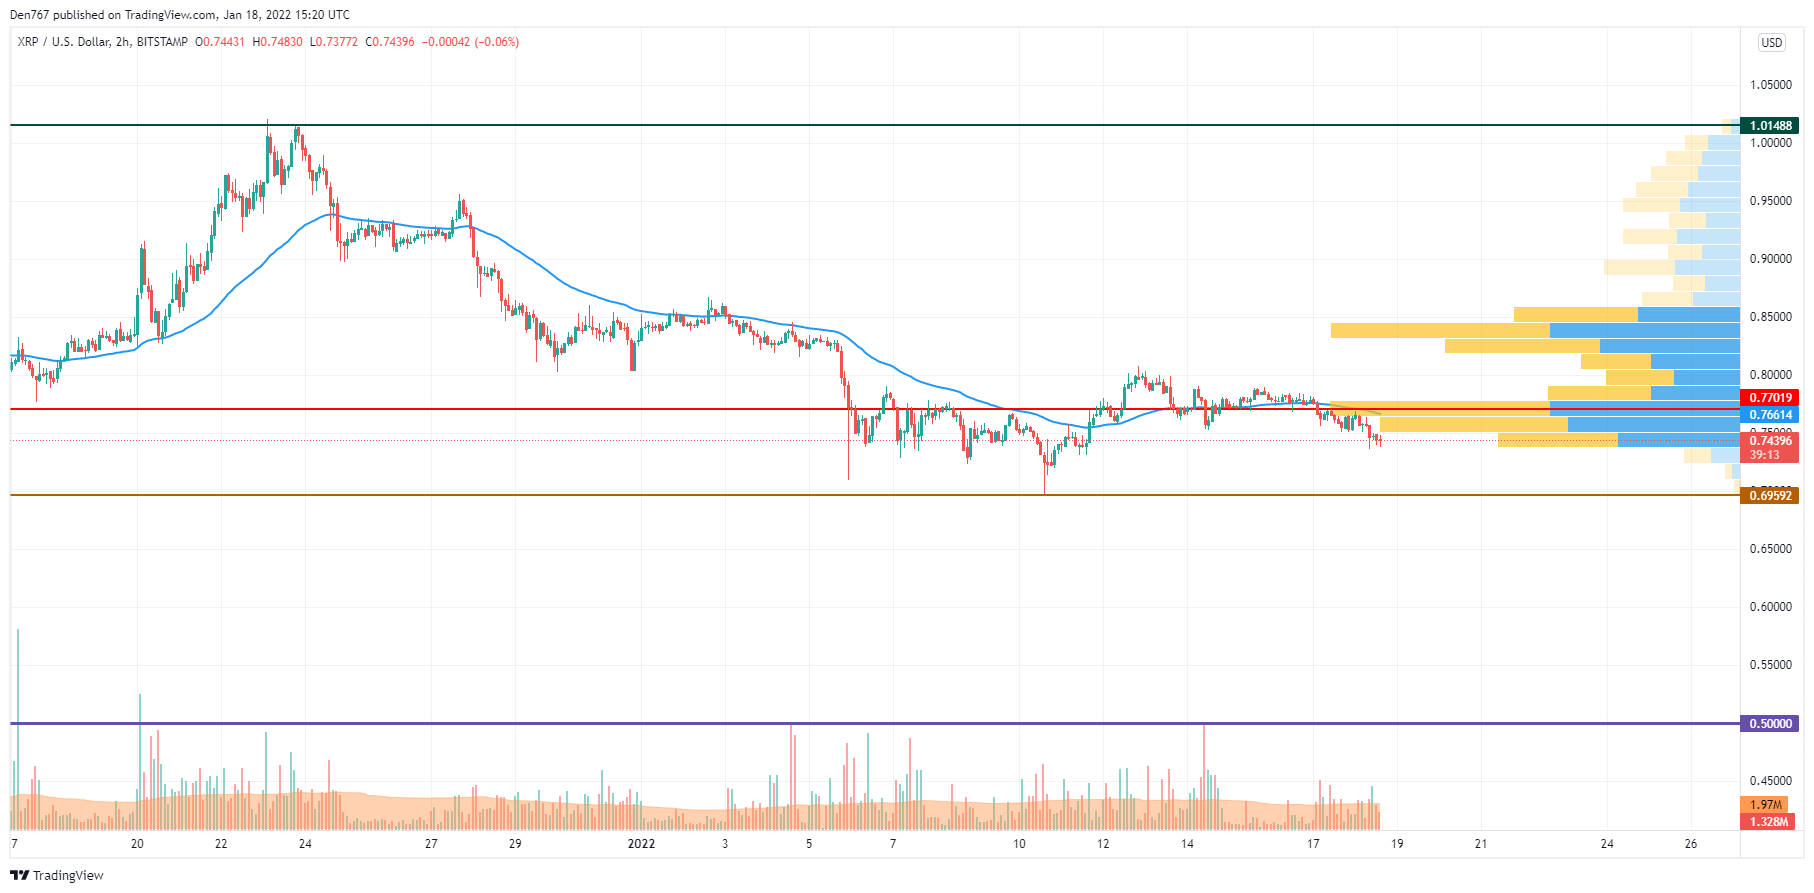
Today, during the day, a decline to the support at $0.70 is possible.

However, if the price can stage a breakout above the zone of the most liquidity around $0.77 and fix above it by the end of the day, there is a chance of seeing short-term growth.
XRP is trading at $0.7447 at press time.
BNB/USD
Binance Coin (BNB) is not an exception as the price of the native exchange coin has declined by 2.69% over the last 24 hours.
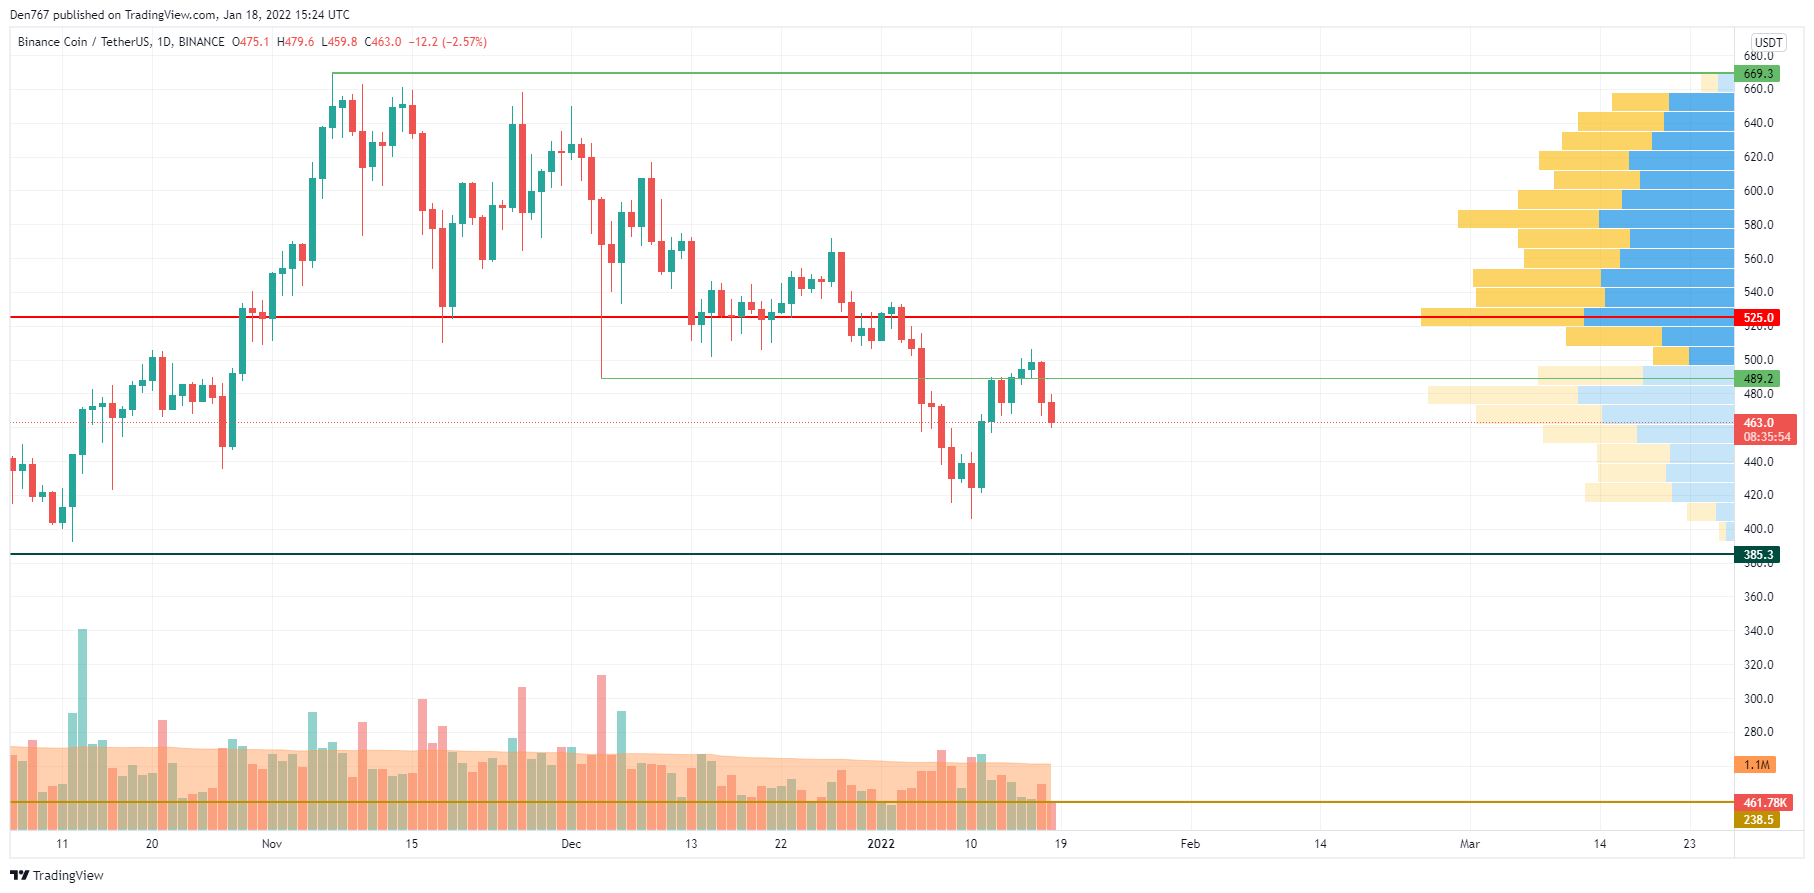
The price of BNB could not hold above the local level at $489. At the moment, bears are more powerful than bulls, which is evident based on rising selling volume. If buyers cannot get back to the previous price level, one may expect a drop to the area around $450 within the nearest days.
BNB is trading at $463.6 at press time.
 Dan Burgin
 U.Today Editorial Team