Disclaimer: The opinions expressed by our writers are their own and do not represent the views of U.Today. The financial and market information provided on U.Today is intended for informational purposes only. U.Today is not liable for any financial losses incurred while trading cryptocurrencies. Conduct your own research by contacting financial experts before making any investment decisions. We believe that all content is accurate as of the date of publication, but certain offers mentioned may no longer be available.
XRP appears to be on the edge of a potentially massive run, according to several indicators. Notably, XRP continues to move within a descending price channel, often recognized as a falling wedge pattern in technical analysis. This trend could be hinting at an impending bullish reversal, but there are key price marks to keep an eye on.
Firstly, a closer look at XRP’s chart reveals a falling wedge pattern, a technical formation typically considered bullish. It is characterized by lower highs and lower lows, with the lines eventually converging. The falling wedge suggests that although selling pressure is present, buyers are steadily stepping in at lower levels. Should XRP's price break out above the wedge's upper trend line, the coin may see a substantial upward swing.
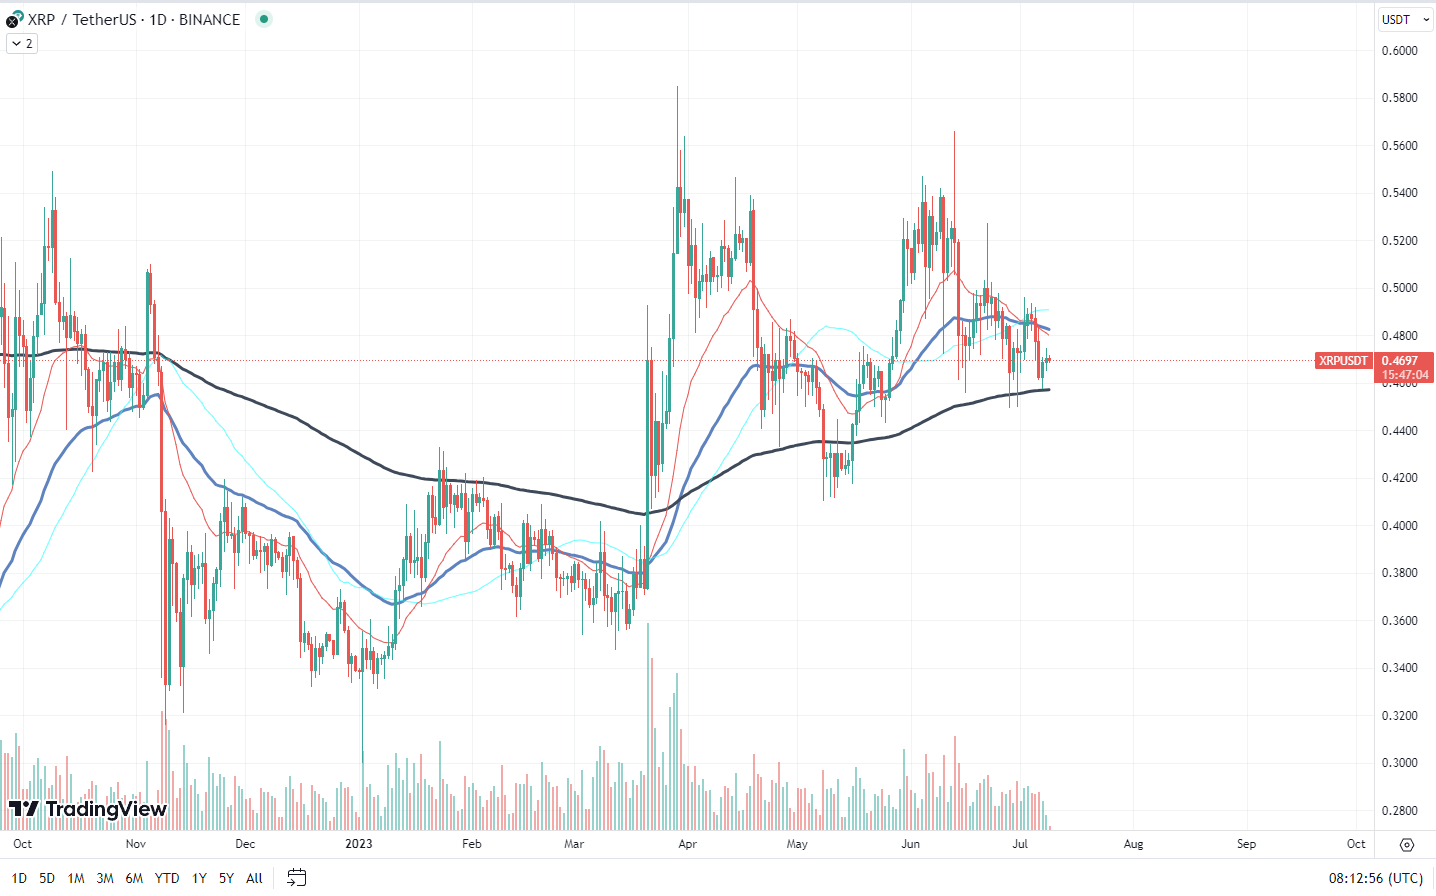
However, a crucial factor to consider is the trading volume, which has been descending alongside the falling price. This indicates a decrease in selling pressure and may act as a precursor to a trend reversal. Lower volume during a downward trend is often seen as a positive sign as it shows reduced interest in selling the asset at the current price levels. This waning selling interest may tip the balance in favor of buyers, leading to an upward price swing.
The Relative Strength Index (RSI), a momentum oscillator that measures the speed and change of price movements, has been moving sideways. This suggests a balanced market with buying and selling pressures relatively equal. However, a significant movement in either direction may give an early indication of where the price is heading next.
While XRP's current technical setup points to a possible bullish breakout from its falling wedge pattern, traders and investors should monitor the price behavior closely. The key price marks to watch would be the upper trend line of the wedge and whether there is a corresponding surge in volume to support any breakout. As always, it is essential to employ rigorous risk management and not solely rely on technical analysis for investment decisions.
 Dan Burgin