Disclaimer: The opinions expressed by our writers are their own and do not represent the views of U.Today. The financial and market information provided on U.Today is intended for informational purposes only. U.Today is not liable for any financial losses incurred while trading cryptocurrencies. Conduct your own research by contacting financial experts before making any investment decisions. We believe that all content is accurate as of the date of publication, but certain offers mentioned may no longer be available.
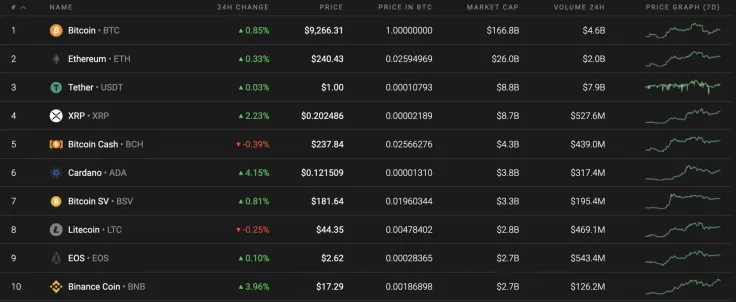
Saturday started out on a relatively positive note for the crypto market. Most of the coins were in the green except for Bitcoin Cash (BCH) and Litecoin (LTC), in which the rates have declined by 0.39% and 0.25% respectively.
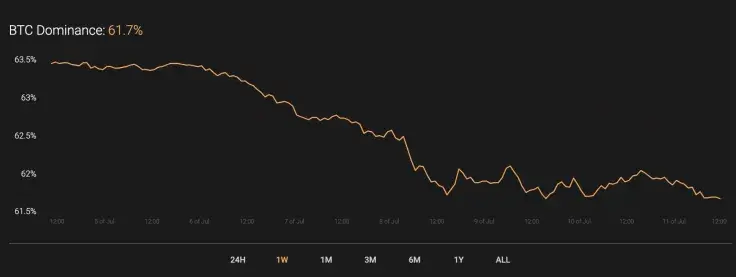
Meanwhile, the market share for Bitcoin (BTC) continues to decline, losing about 2% since the beginning of the week.
Below is the relevant data for Bitcoin (BTC) and how it is looking today:
-
Name: Bitcoin
Advertisement -
Ticker: BTC
-
Market Cap: $170,408,817,398
-
Price: $9,246.43
Advertisement -
Volume (24H): $15,590,655,185
-
Change (24H): 0.68%
BTC/USD: Can Traders Expect Sharp Moves at Weekends?
Bitcoin (BTC) has had one of the least volatile weeks. The rate for the leading crypto has remained relatively unchanged from the previous 7 days.
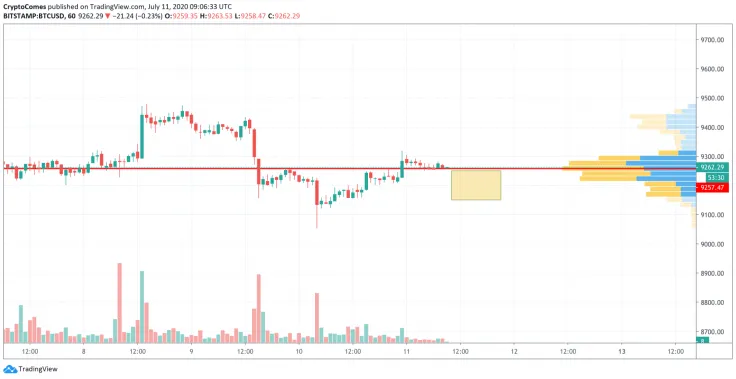
Looking at the hourly chart, Bitcoin (BTC) is slowly dropping against a declining trading volume. The most likely scenario for the weekend is trading sideways between the yellow range of $9,150 and $9,250. The coin is unlikely to go down further as there is no selling volume for that to occur and there is almost no liquidity below $9,000.
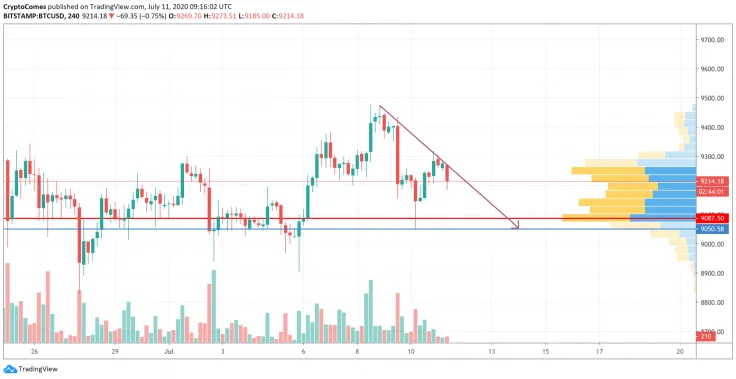
Looking at the bigger time frame, the bears are gaining strength as they continue to push the rate down. Thus, there is no resistance from buyers as the trading volume drops. This drop might continue to the $9,050 level, where most of the liquidity is located. Such a scenario might happen within the next few days.
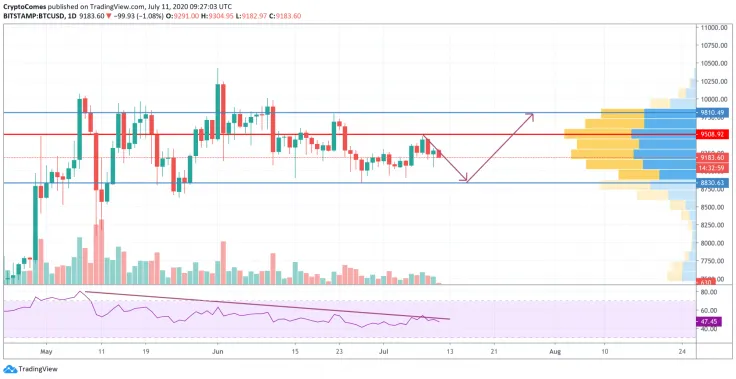
Looking at the daily chart, the decline prevailed over the growth, which was confirmed by the bearish Relative Strength Index (RSI). The drop may be towards the $8,800 area, which is a far level retest that last occurred near the end of May, and the bears might find obstacles to break from it for the first time. In this particular case, the most likely scenario is a bounce off the $8,800 zone, followed by a continuation upswing above $9,000 by the end of the next week.
At press time, Bitcoin was trading at $9,192.
 Yuri Molchan
 Gamza Khanzadaev
 Godfrey Benjamin