
Disclaimer: The opinions expressed by our writers are their own and do not represent the views of U.Today. The financial and market information provided on U.Today is intended for informational purposes only. U.Today is not liable for any financial losses incurred while trading cryptocurrencies. Conduct your own research by contacting financial experts before making any investment decisions. We believe that all content is accurate as of the date of publication, but certain offers mentioned may no longer be available.
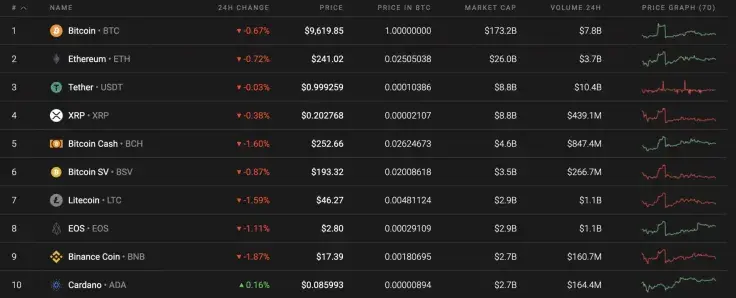
The quotes for Bitcoin (BTC), as well as other coins, have remained relatively unchanged since yesterday. The only exception is Cardano (ADA), which has gone up by 0.16% within the last day.
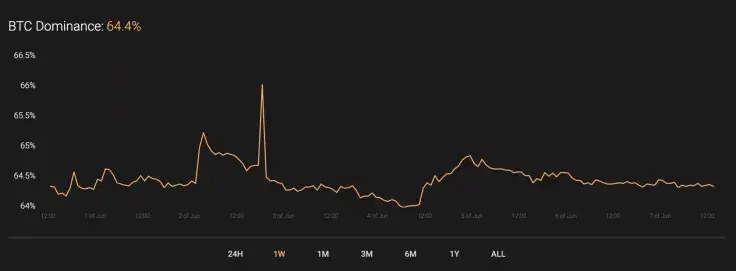
However, Bitcoin's market share has remained the same over the course of the week. Its current index sits at 64.4%.
Below is the relevant data of Bitcoin (BTC) and how it is looking today:
-
Name: Bitcoin
Advertisement -
Ticker: BTC
-
Market Cap: $177,196,986,658
-
Price: $9,631.74
Advertisement -
Volume (24H): $18,992,088,158
-
Change (24H): -0.47%
BTC/USD: Has the Bull Run Come to an End?
Looking at the hourly time frame, Bitcoin (BTC) has been trading within a falling channel since June 4th. Meanwhile, the main crypto has gone up by 0.20% since last week against the start of a correction.
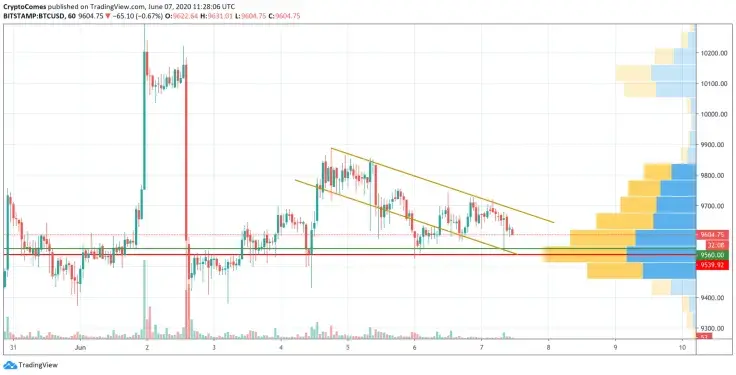
From a technical perspective, the short-term correction is ongoing due to the absence of buyers to push the rate higher. There is also low liquidity support above $9,700, which confirms the ongoing decline. The nearest support zone is between $9,400 and $9,450.
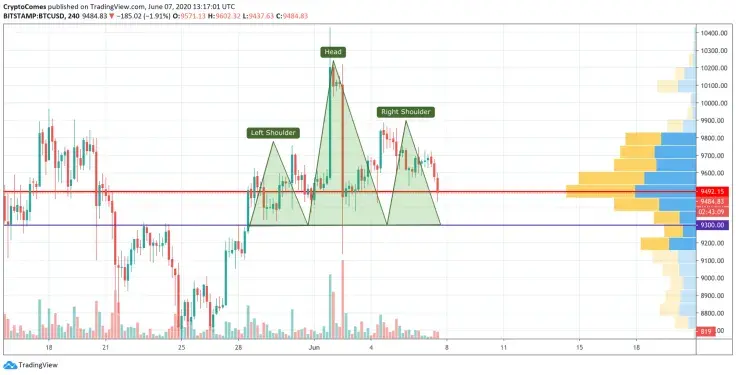
Looking at the 4H time frame, the bearish sentiment is even more powerful. Bitcoin (BTC) is about to finish forming a Head and Shoulders pattern. That is a reversal figure, suggesting a change in trend. If the bears continues to push the price downwards, then the first stop is at the $9,300 mark. This might be attained next week.
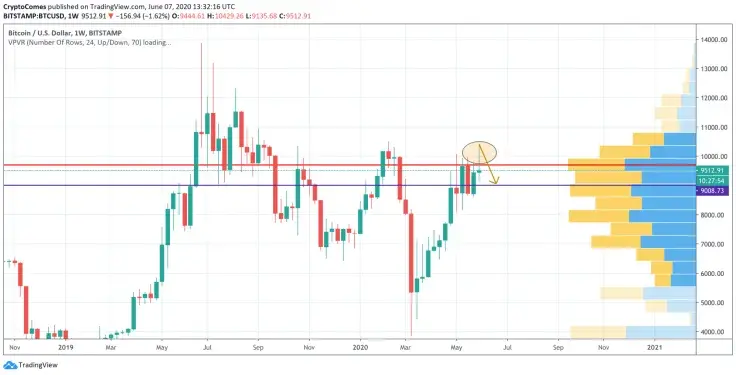
The current candle is going to close with a long wick on the weekly chart, which is a bearish signal. Overall, BTC might confirm our previous prediction that the bullish trend, which started since mid-March, is coming to an end. Respectively, the bears are not targeting the vital support at the $9,000 mark. If the first days of the week are bearish, then the $9,000 mark will be reached next week.
At press time, Bitcoin was trading at $9,487.
 Dan Burgin
 U.Today Editorial Team