
Disclaimer: The opinions expressed by our writers are their own and do not represent the views of U.Today. The financial and market information provided on U.Today is intended for informational purposes only. U.Today is not liable for any financial losses incurred while trading cryptocurrencies. Conduct your own research by contacting financial experts before making any investment decisions. We believe that all content is accurate as of the date of publication, but certain offers mentioned may no longer be available.
Ethereum (ETH) presents an intriguing case as it flirts with the psychologically significant $2,000 mark. Recently, ETH has demonstrated commendable strength, breaking through its local resistance level, which now appears to be acting as a solid support zone. This event marks a potential paradigm shift for the second-biggest asset by market capitalization in the crypto arena.
The recent price action of Ethereum tells a story of resilience and potential. After a period of consolidation, ETH has managed to surge past a resistance level that had previously capped its upward movements. This breakthrough is significant; it indicates a shift in market sentiment and establishes a new foundation upon which Ethereum may build its next climb.
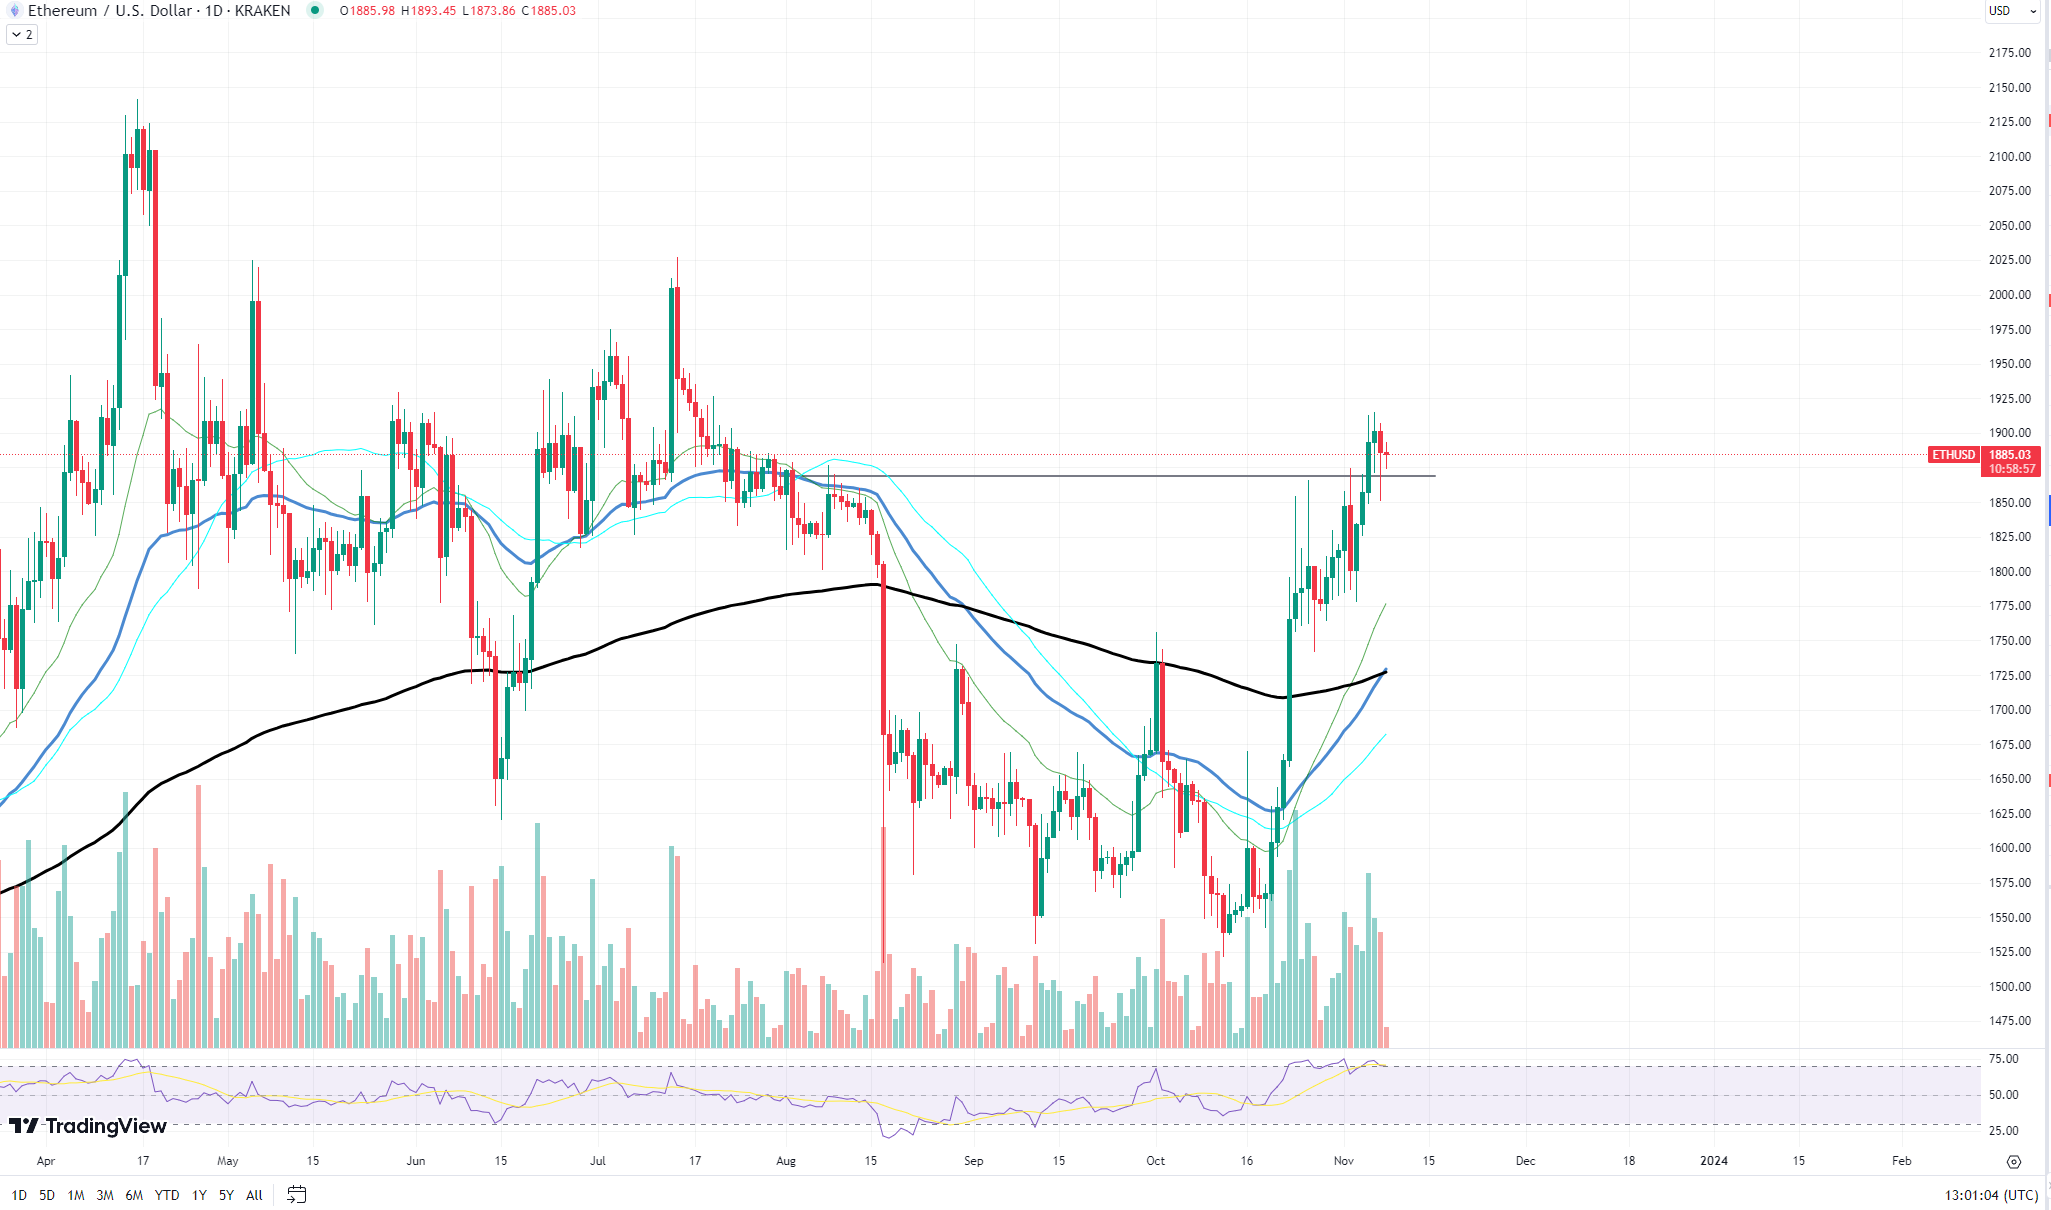
Historical price patterns suggest that once a resistance level is transcended, it often transforms into a support level. For ETH, this could mean that the price level it has just surpassed may well become a launchpad for further gains.
Looking at the volume profiles, the recent move upward has been accompanied by a noticeable increase in trading volume, lending credence to the breakout's sustainability. High volume is a strong indicator of genuine market movement, implying that the current price level is backed by substantial interest and participation from market participants.
As Ethereum inches toward the $2,000 level, the crypto community is abuzz with speculation about the potential for a further price movement upward. If the newfound support level holds, ETH may well have paved the groundwork for a sustained upward trajectory.
Shiba Inu under pressure
Shiba Inu (SHIB) faces a critical juncture as it hovers around the formidable 200-day Exponential Moving Average.
Moving Average (EMA), a significant level that often demarcates the bullish from the bearish territories. The EMA is a trend-following indicator, smoothing out price data over a period of time and placing significant weight on recent prices. For SHIB, the challenge to break and hold above this level is substantial due to its past performance and current market dynamics.

As of the latest charts, SHIB's price hovers just below the 200 EMA, indicating a troublesome state for the token. The 200 EMA acts as a resistance level, a threshold where selling pressure is likely to be encountered. Traders and investors are watching closely to see if SHIB can muster the buying strength to break through this resistance.
The volume profile presents a mixed signal; although there has been an uptick in volume, it is not decisively high enough to confirm a robust breakout pattern. This suggests a lack of conviction among buyers, making the possibility of breaking above the 200 EMA less certain.
A sustained break above the 200 EMA could open the door to a potential bullish scenario, where confidence might build and invite further buying pressure. However, without strong volume support, any attempt to rise above this level could be short-lived, potentially leading to a false breakout and subsequent sell-off.
Three scenarios for Cardano
Cardano (ADA) has been a standout on the market thanks to outstanding price performance. Its recent price movements have caught the eye of investors and traders alike, looking to decipher the future course of ADA's valuation. Based on the provided daily chart of ADA against USD, we explore three possible scenarios for Cardano's imminent price trajectory.
Scenario 1: Bullish continuation
The current chart shows ADA has been on an upward trend, breaking past previous resistance levels. With the moving averages (MAs) aligning below the price and the trend appearing to move upward, there is a solid argument for continued bullish momentum.
Scenario 2: Consolidation before next move
After a sharp move upward, assets often enter a period of consolidation, where the price stabilizes before the next significant move. For ADA, this could mean moving sideways as the market decides its next direction.
Scenario 3: Bearish reversal
Despite the current bullish appearance, the possibility of a bearish reversal cannot be ignored. If ADA fails to maintain its current support level, it may signal a sell-off. A break below the recent bullish candlesticks and moving averages could indicate a trend reversal.
 Dan Burgin
 U.Today Editorial Team