
Disclaimer: The opinions expressed by our writers are their own and do not represent the views of U.Today. The financial and market information provided on U.Today is intended for informational purposes only. U.Today is not liable for any financial losses incurred while trading cryptocurrencies. Conduct your own research by contacting financial experts before making any investment decisions. We believe that all content is accurate as of the date of publication, but certain offers mentioned may no longer be available.
Veteran trader Peter Brandt has recently made a prediction about Bitcoin's future that might be unsettling if you consider yourself a BTC bull. In his analysis from March 16, shared with his private group, Brandt pointed to the possibility of a significant Bitcoin correction.
Brandt laid out three scenarios for Bitcoin's path forward. The first was a new parabolic advance that might reconnect the lows of November 2022 and September 2023, potentially sending Bitcoin back to $40,000. However, he was not fully convinced this would happen, leaving room for doubt.
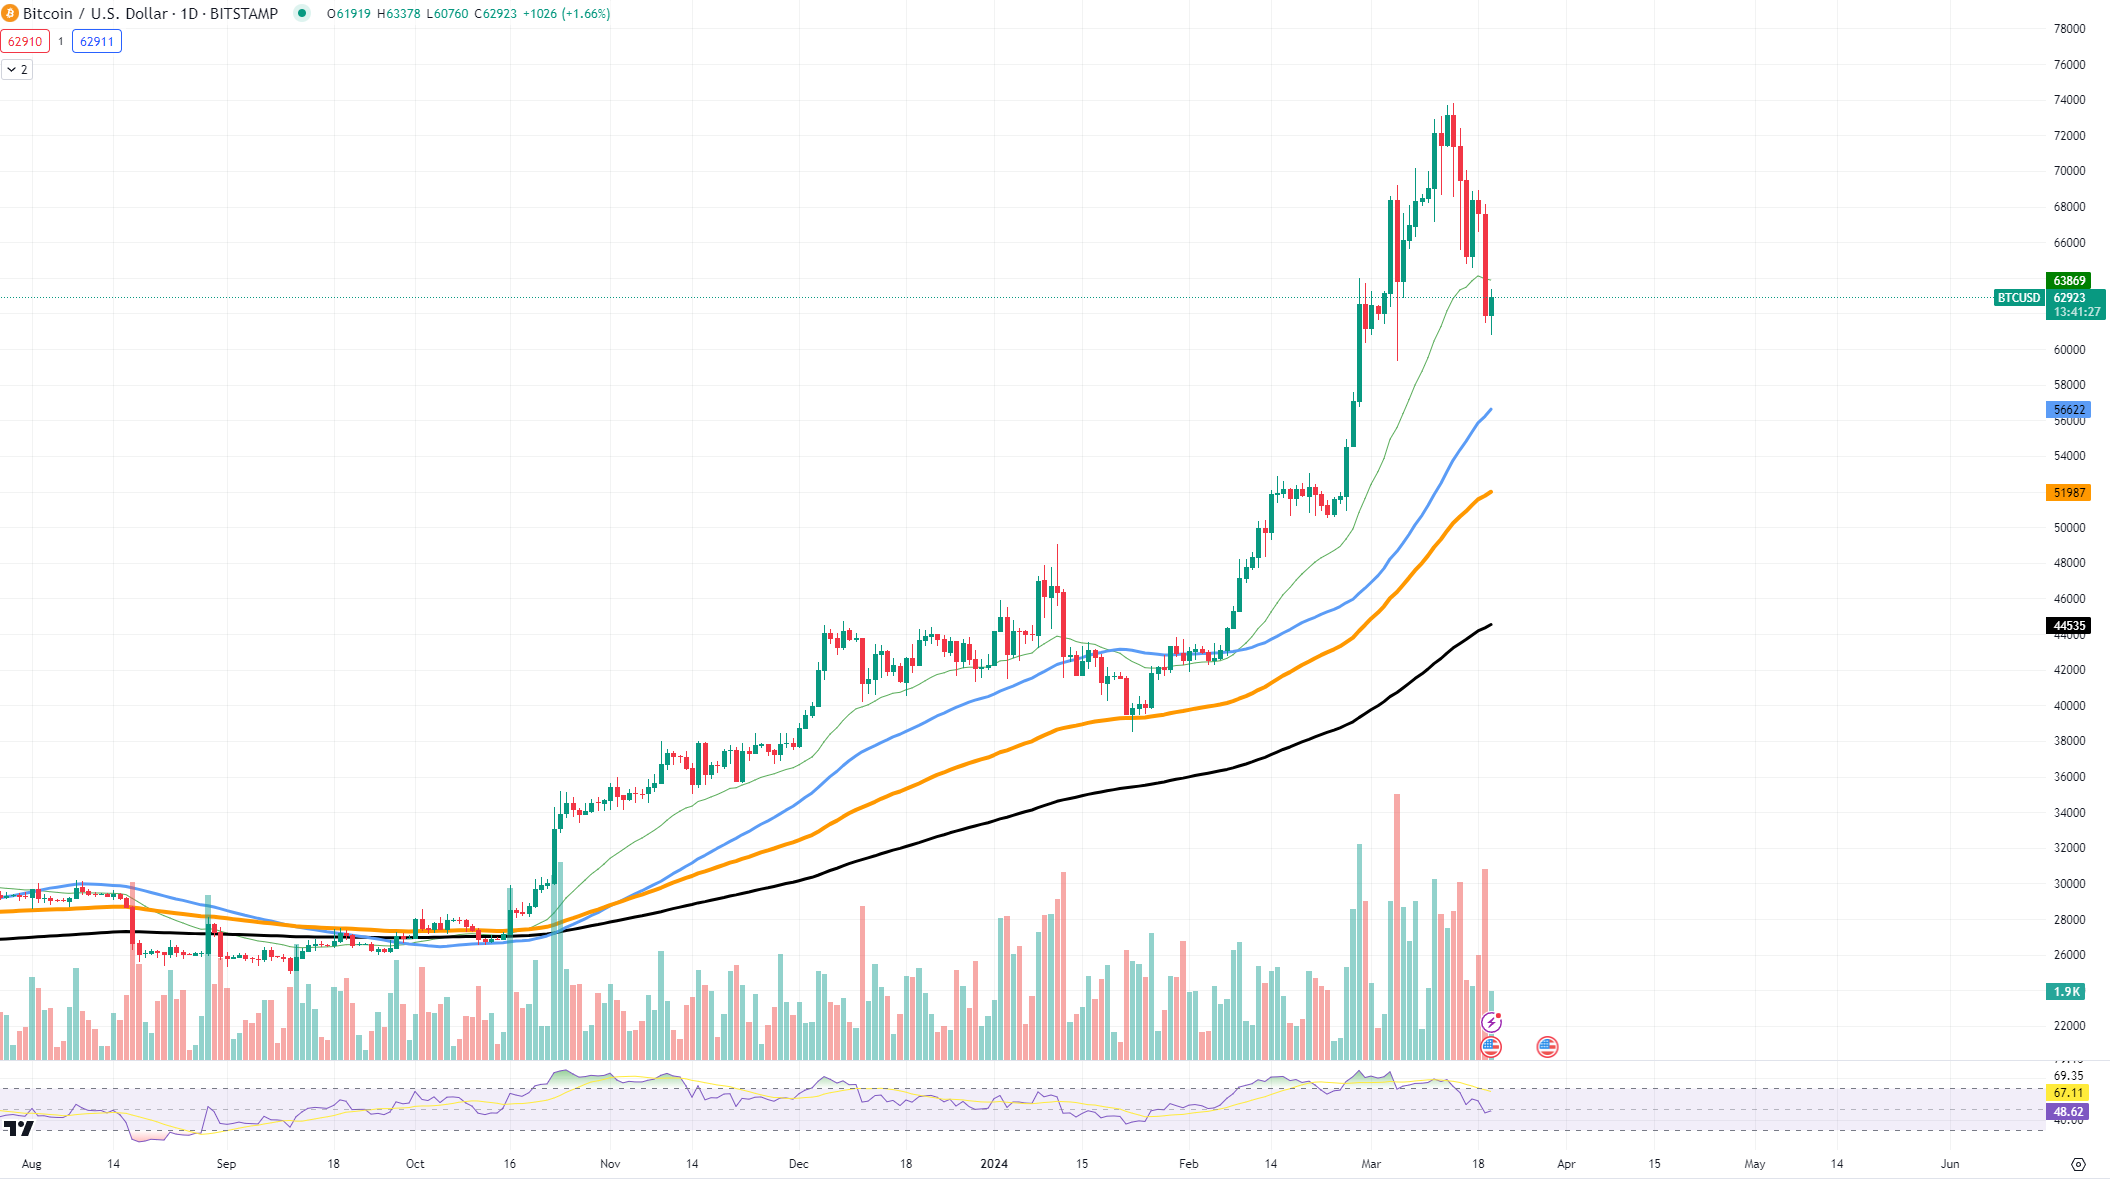
His second scenario was a correction to Bitcoin’s upper channel boundary that had accelerated on Feb. 24, 2024. This would mean a drop to the $55,000 to $60,000 range — a correction from $73,800. However, this scenario was also marked as unlikely.
The third scenario, which Brandt found most likely, was an "upward chop" with corrections under 15%. In other words, the price might move up and down but not crash or skyrocket. This would bring Bitcoin to around $63,000 with each correction.

Brandt's analysis included attention to the Bitcoin Renko chart, which continued to show green, indicating a general uptrend. A three-day Renko chart was mentioned, which could signal vulnerability for Bitcoin if a red block appears, suggesting a downward trend.
Bitcoin's price has been showing an enormous volatility ride. While the past performance of Bitcoin has seen incredible highs, it has also faced steep drops, reminding us that what goes up can come down — and sometimes hard.
Economic factors, such as interest rate changes, investment trends and market confidence, can all cause price swings; however, the key reason behind the digital gold's most recent correction is purely speculative as the overextended market led to the massive surge of liquidation from both sides, creating enormous imbalance and pushing BTC to the ground.
 Dan Burgin
 U.Today Editorial Team