Disclaimer: The opinions expressed by our writers are their own and do not represent the views of U.Today. The financial and market information provided on U.Today is intended for informational purposes only. U.Today is not liable for any financial losses incurred while trading cryptocurrencies. Conduct your own research by contacting financial experts before making any investment decisions. We believe that all content is accurate as of the date of publication, but certain offers mentioned may no longer be available.
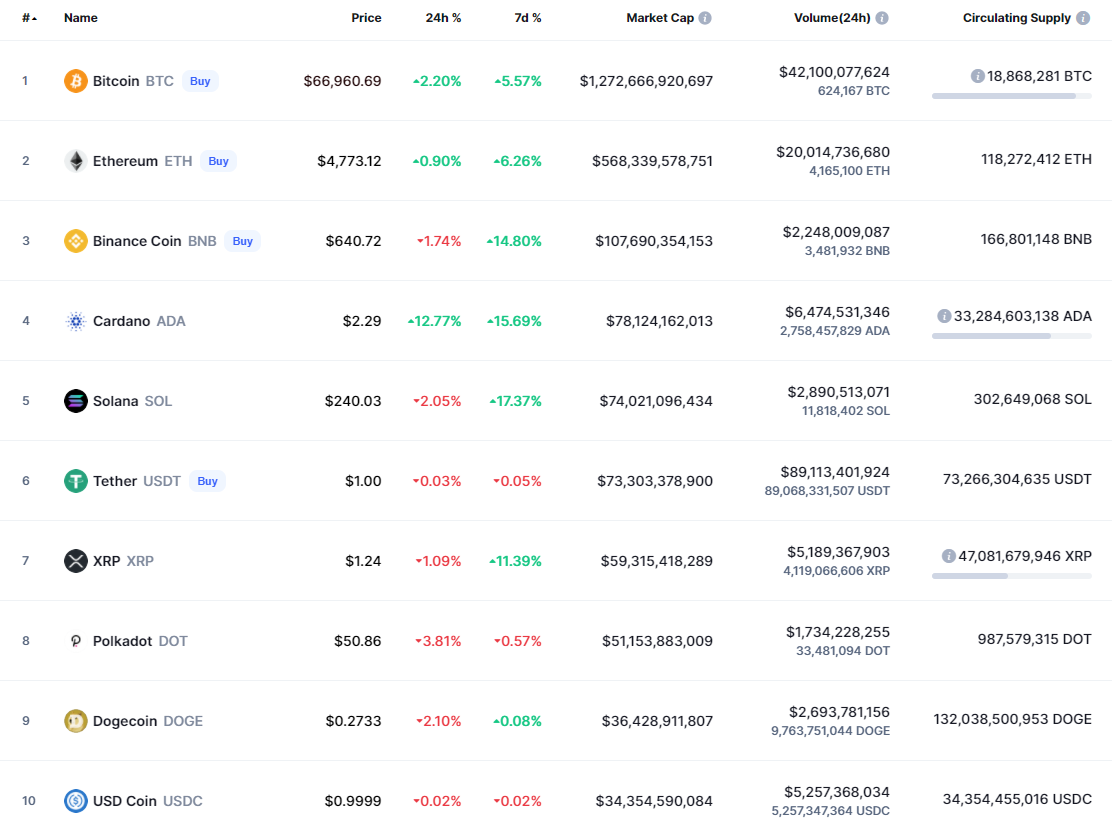
The top coins remain in the bullish zone; however, others have already entered the correction phase.
BTC/USD
Yesterday, the bulls were able to continue their run and gain a foothold above the 100% fibo ($64,895). At night, they managed to renew the absolute maximum, set at around $67,000. The pair tested the level of $68,560 this morning.
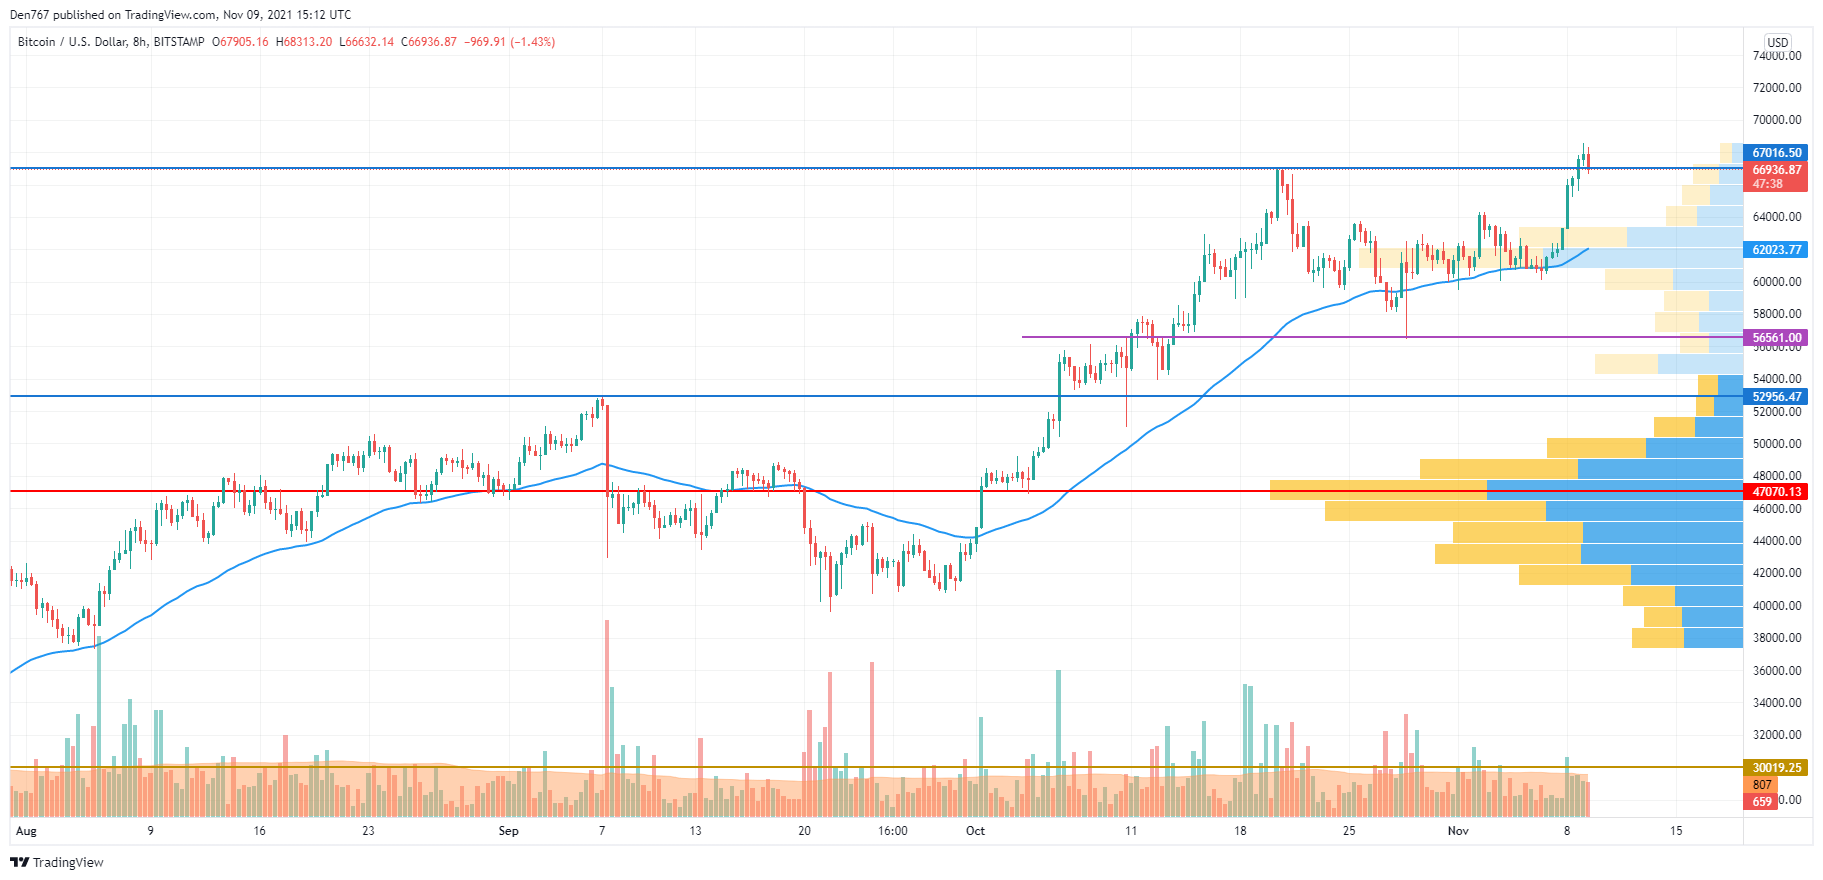
At the moment, the volume of purchases has decreased slightly and the growth has slowed down. However, if the bulls resume their onslaught, then another bullish impulse could test the psychological level of $70,000 in the near future.
Bitcoin is trading at $66,978 at press time.
LTC/USD
Litecoin (LTC) is the main gainer today. The rate of the "digital silver" has rocketed by 23% over the last day.
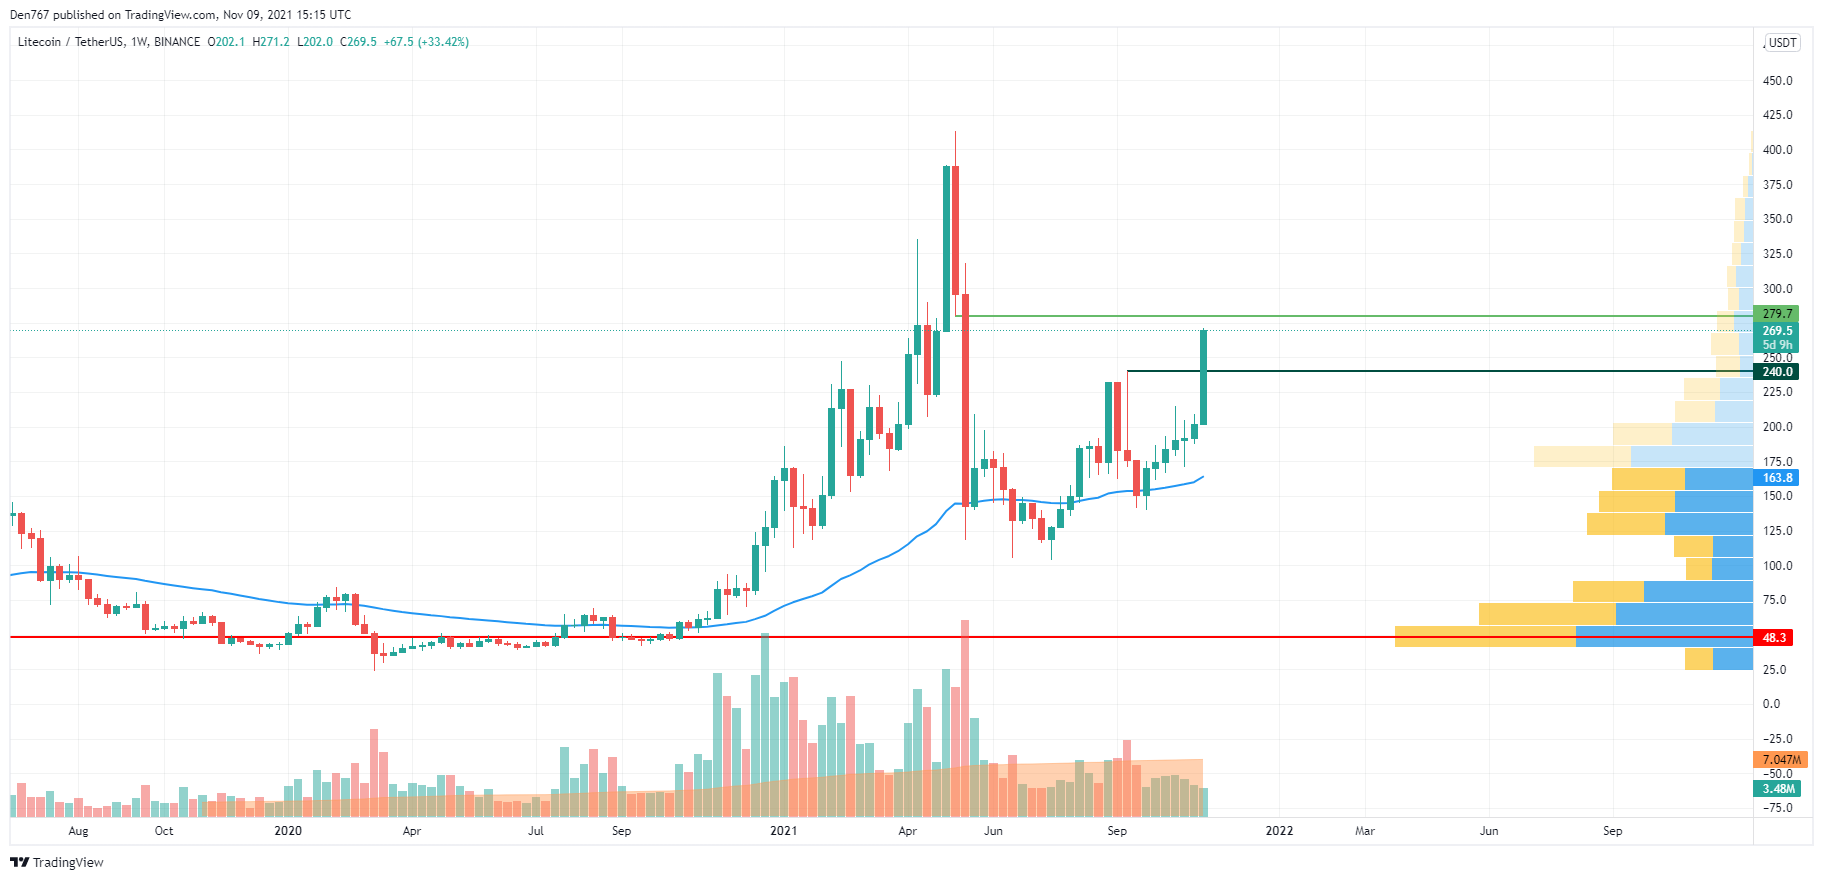
Litecoin (LTC) is about to approach the mirror level at $279.7. Despite the sharp rise, the trading volume is not high, which means it might be difficult for bulls to break it from the first attempt.
If they fail to do that, one may expect the test of the support at $240 by the end of the week.
LTC is trading at $267 at press time.
BNB/USD
Binance Coin (BNB) is the only falling coin from today's list. The price of the native exchange coin has gone down by 1.16%.
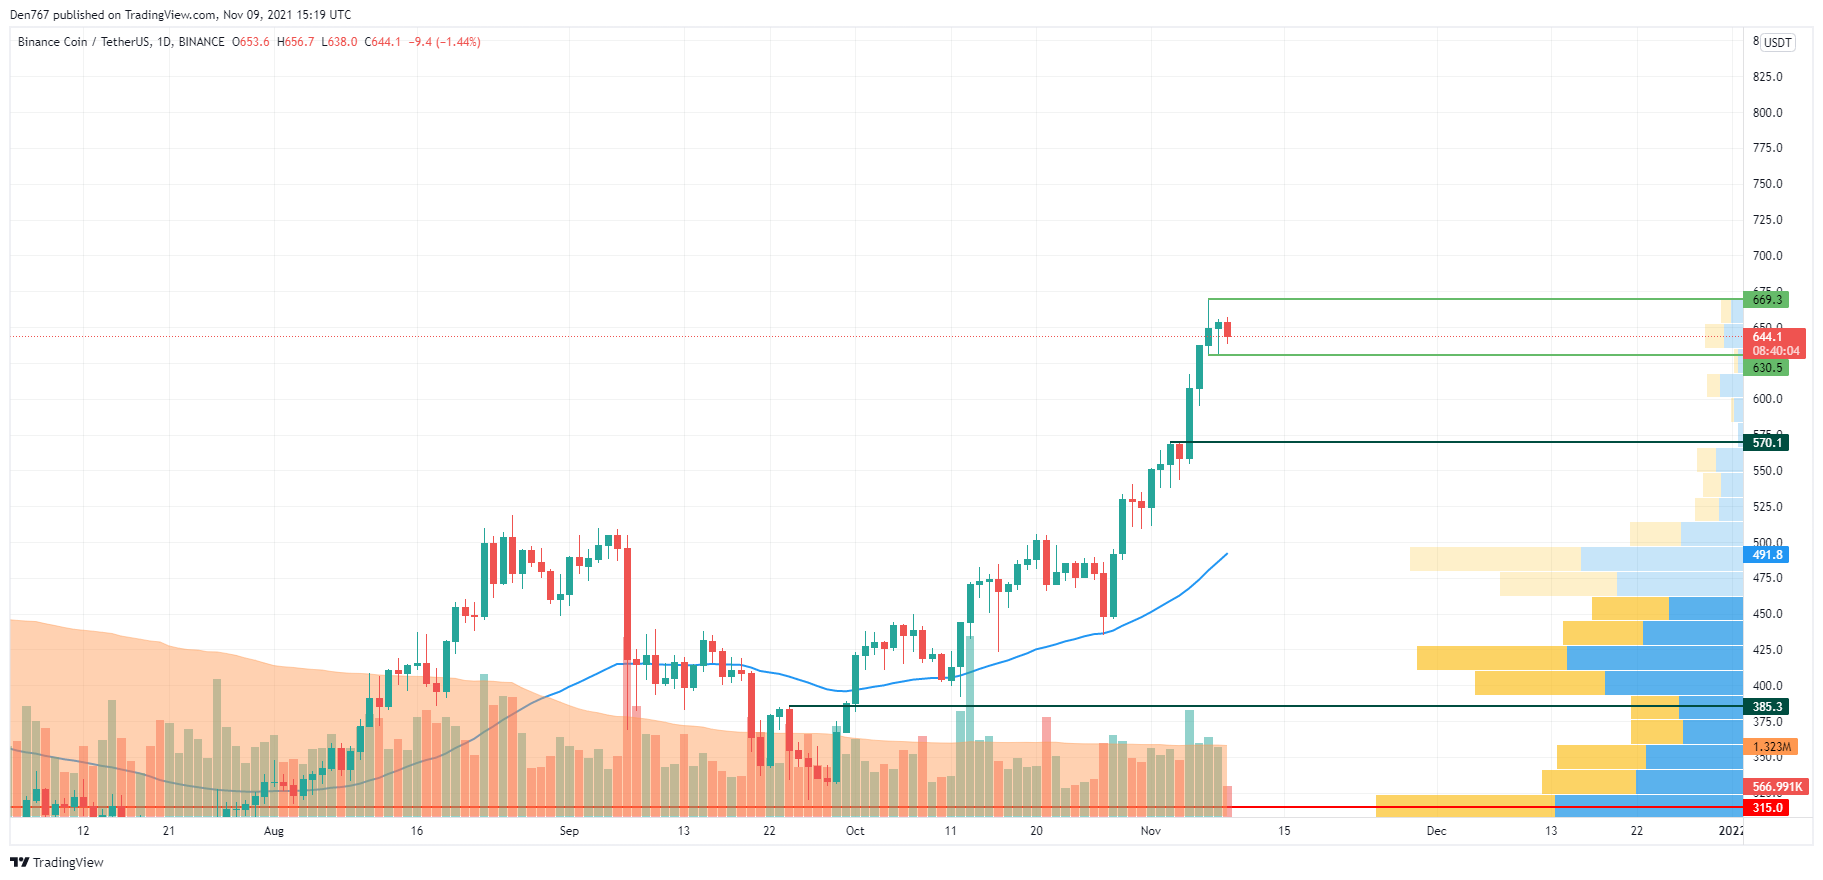
Binance Coin (BNB) is stuck within the support at $630 and the resistance at $669. At the moment, the coin is trading sideways, which is confirmed by the low volume.
All in all, one needs to to wait until BNB approaches either the support or resistance to see which side seizes the initiative.
BNB is trading at $643 at press time.
 Godfrey Benjamin
 Yuri Molchan
 Gamza Khanzadaev
 Arman Shirinyan
 Alex Dovbnya