
By the beginning of Friday, despite numerous signals to the contrary, the bearish trend persisted on the cryptocurrency market. Now it’s clear that the situation is not just a local, but a full-fledged correction that involves all assets. Due to the buyers’ indecision, total market capitalization decreased to $425 bln which is comparable to the value from Feb. 10, while Bitcoin dominance did not change and still makes up 39.2 percent. The instigator of the whole event (yes, we do mean Bitcoin) lost close to 10 percent in the course of 24 hours, trading around $9,800.
Investors are digging their own graves
In yesterday's review, we mentioned this scenario, although its likelihood was not high. At the moment, the decline is taking place in the absence of any negative crypto industry news, so we can fully appreciate the power of the collective unconscious in the market. Investors, apparently still not recovered from the events of Feb. 5-6, are prepared to book minimal profits or just break even, for fear of history repeating. But history does not repeat quite so quickly, and we are not yet discussing the possibility of new lows. This correction cannot be a protracted one by definition. Therefore the main recommendation for readers remains in force, remain calm and avoid rash decisions. Profits will come to those who are patient.
All assets show similar decline rates
Returning to cryptocurrency prices, let’s take a look at the top 10. Ethereum was least affected, with a loss of 4.5 percent. Litecoin suffered the most, falling by almost 15 percent. Other coins are spread out between them, with decreases of 10 to 12 percent. Beyond the top 10 the situation is similar: except for some individual coins that showed one digit growth, the average price drop is also about 12 percent.
BTC/USD
With their panic sales, Bitcoin investors continue to create problems for themselves which they will have to overcome later with great effort. We're talking about the young descending channel that formed at the peak three days ago. Now, to confirm the growth scenario, the price has to overcome this channel first, and only then make a second attempt at the long-term descending channel.
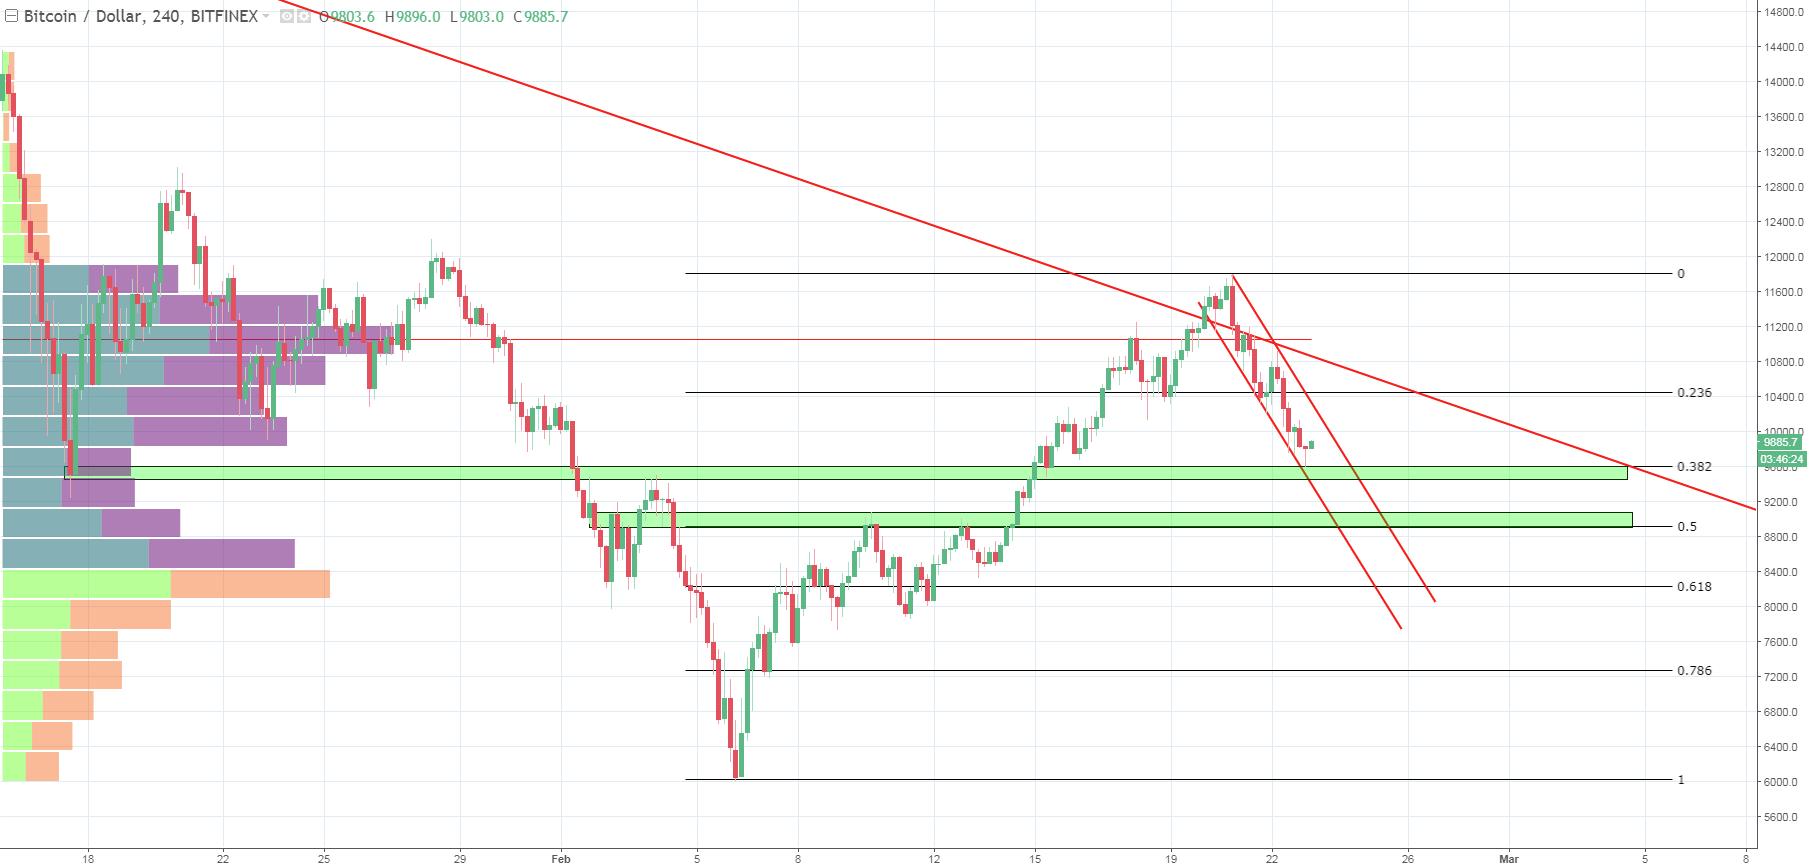
The current price decline was stopped at the 0.382 Fibonacci retracement and now Bitcoin price is at the $9,800 mark, which we also mentioned yesterday. If the decline continues, the next strong support level will be the $8,900-$9,000 zone. Judging by the volume profile, this is the range where purchases predominated over sales. In addition, this is where we find the equally strong 0.5 Fibonacci retracement.
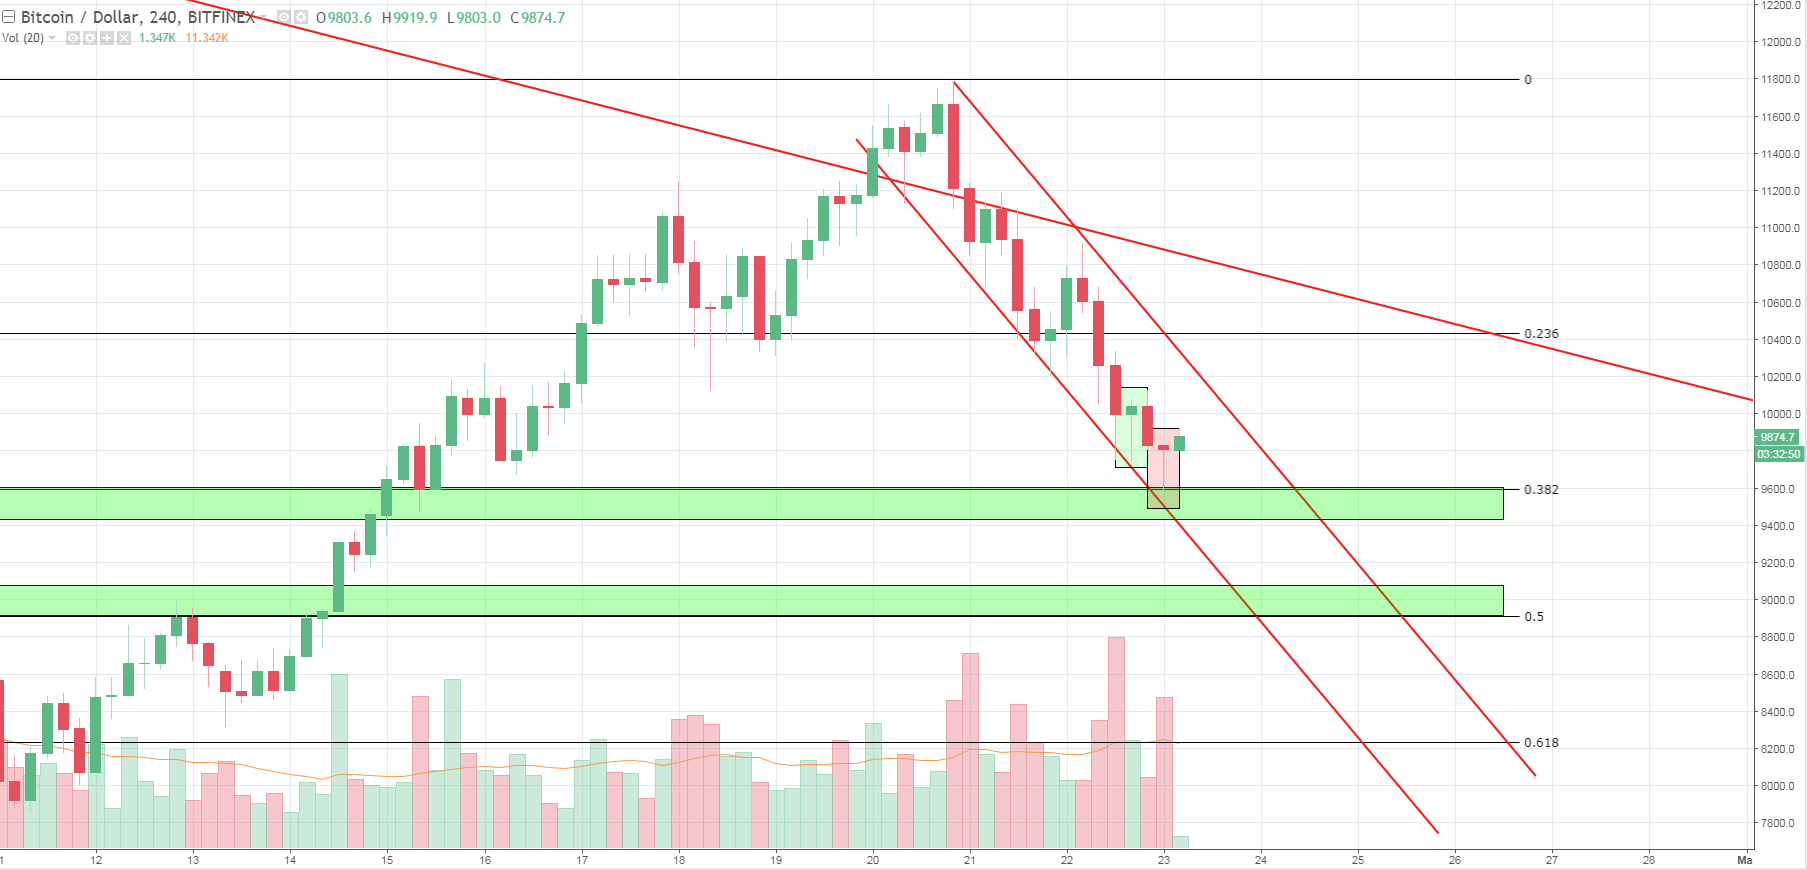
Japanese candles indicate that a rapid change in the trend is possible. We see two “hammer” candles with long shadows and short bodies. Often, such combinations anticipate a reversal or in any case reveal that buyers have started to defend the price. At such levels, buyers should have no reason to sell long positions.
ETH/USD
After the previous collapse, Ethereum was recovering more slowly than other assets, so it had almost nothing to lose. At the time of writing, ETH is trading around $840 and continues (like other coins) to respond sensitively to the slightest fluctuations in Bitcoin price. The bad news is that in the course of the decline Ethereum had already fallen out of the lower register of the ascending channel, beyond which, there is a void and an absence of trading volumes.
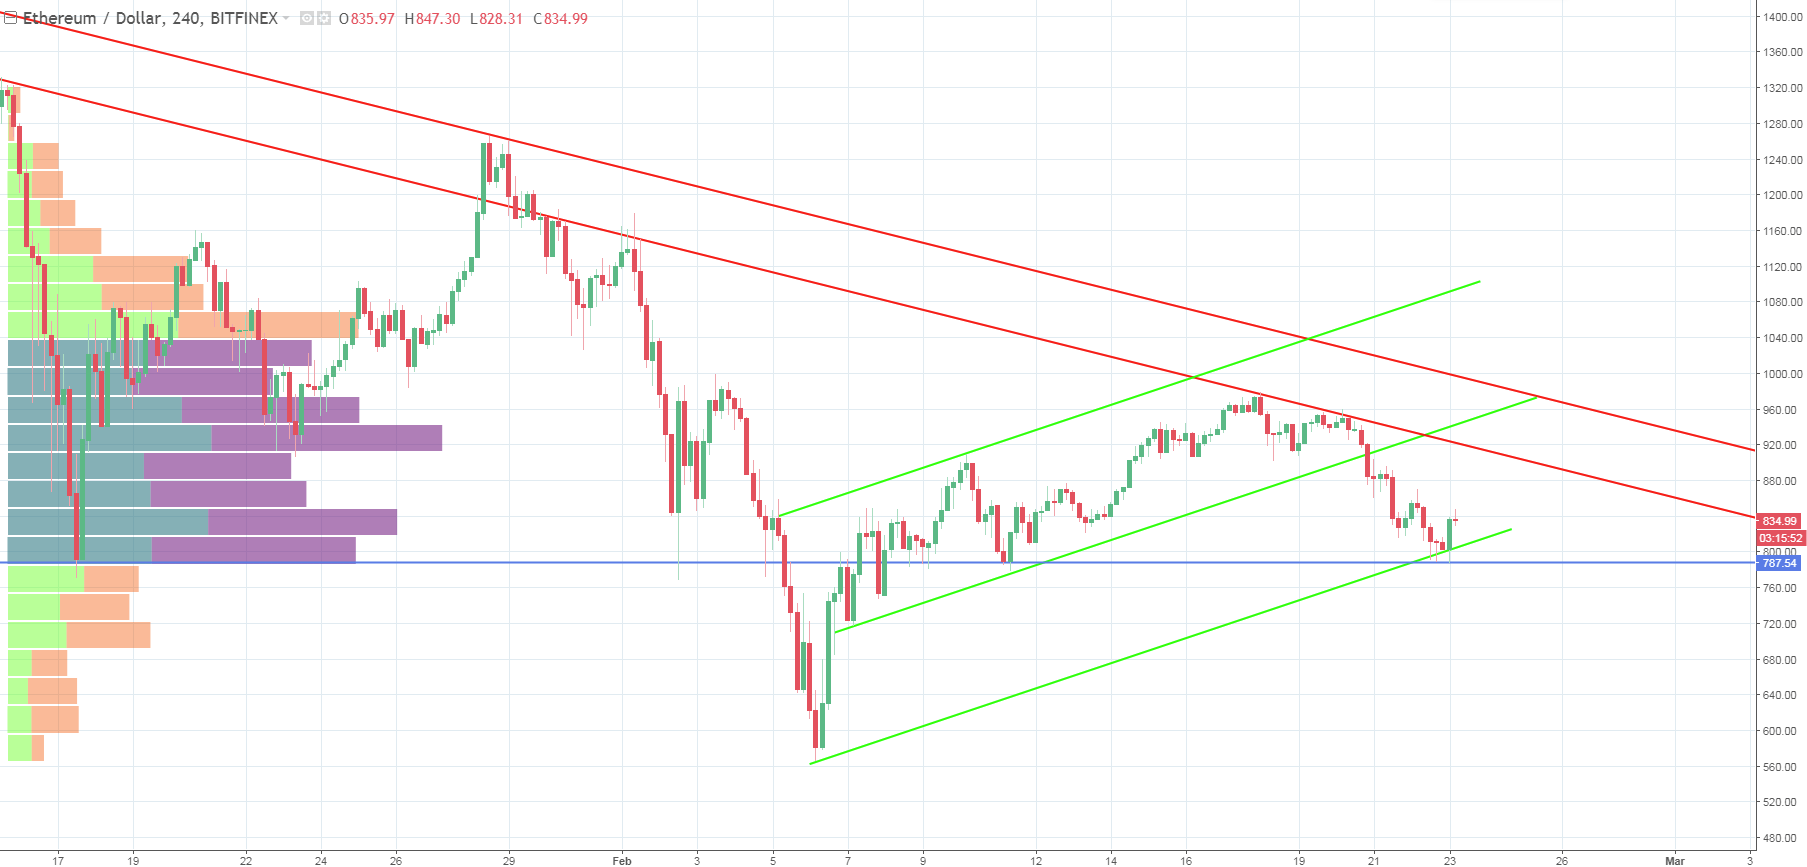
So far, support was found at $790- this price has been touched by the shadows of four-hour candles thrice, and each time buyers found the resources to support the asset. In case of further decline, the next support, formed by the mirror level, will be at $750. The scenario of an increasing Ethereum price is too early to consider, but we advise our readers to watch the boundary of the closest descending channel, transition to active growth will depend on breaking it first.
LTC/USD
Unlike Ethereum, Litecoin did have something to lose, and we were right to recommend that our readers decrease long positions. Thursday’s minimum value was $182, which nearly coincides with the 0.5 Fibonacci retracement. With a great deal of confidence, we can say that the minimum will be updated in the event of further Bitcoin decline.
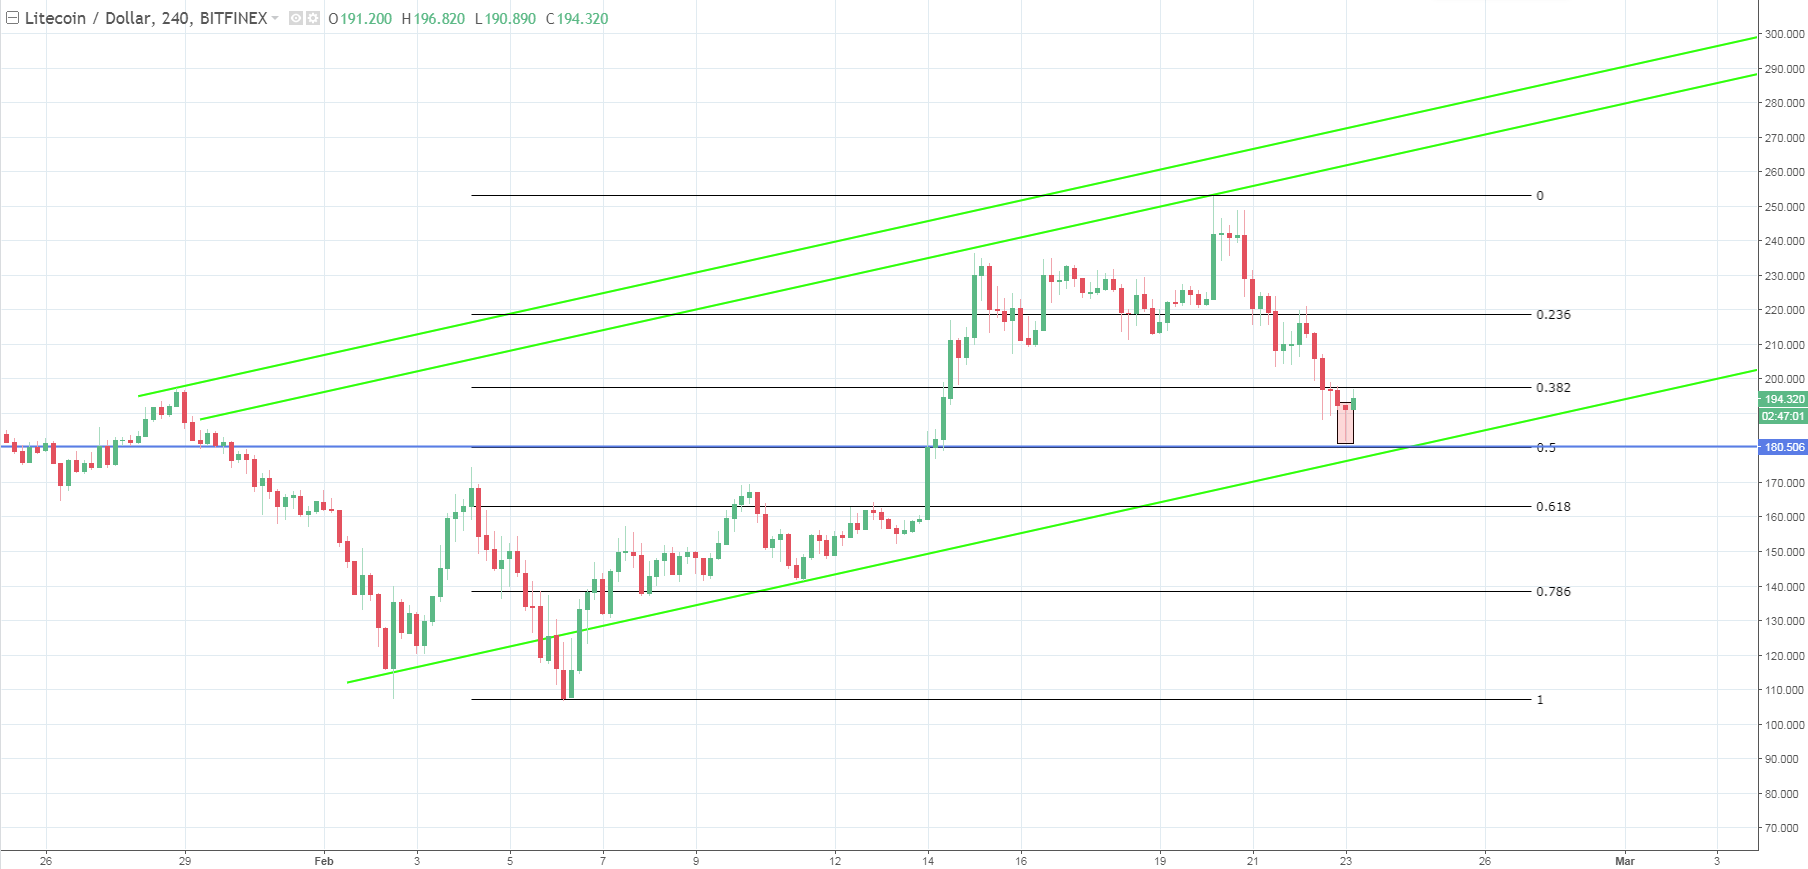
In the event of breaking through the downward channel, the next support level is in the range $163-$168, where readers can safely resume growing long positions. Although, the price may not drop so low, on the chart we see a "hammer" candle, which indicates a possible reversal. In any case, everything will depend on the behavior of Bitcoin, and the closest attention should now be paid to its price fluctuations.
 Dan Burgin