
Disclaimer: The opinions expressed by our writers are their own and do not represent the views of U.Today. The financial and market information provided on U.Today is intended for informational purposes only. U.Today is not liable for any financial losses incurred while trading cryptocurrencies. Conduct your own research by contacting financial experts before making any investment decisions. We believe that all content is accurate as of the date of publication, but certain offers mentioned may no longer be available.
The market is not in a good position in terms of a short-term recovery. Unfortunately, the current composition of investors creates the possibility of a bearish continuation as volatility stays suppressed.
Ethereum's local resistance being scorched
The market’s response here will determine the direction for the upcoming weeks, as Ethereum is headed straight into one of the most significant resistance clusters on its chart. The recent rally off the $2,700 area was a strong, high-momentum push, supported by a discernible increase in buying pressure rather than a feeble bounce. A confluence of short-term moving averages is currently being directly pressed against by the price, and the level of bullishness surrounding ETH is getting harder to ignore.
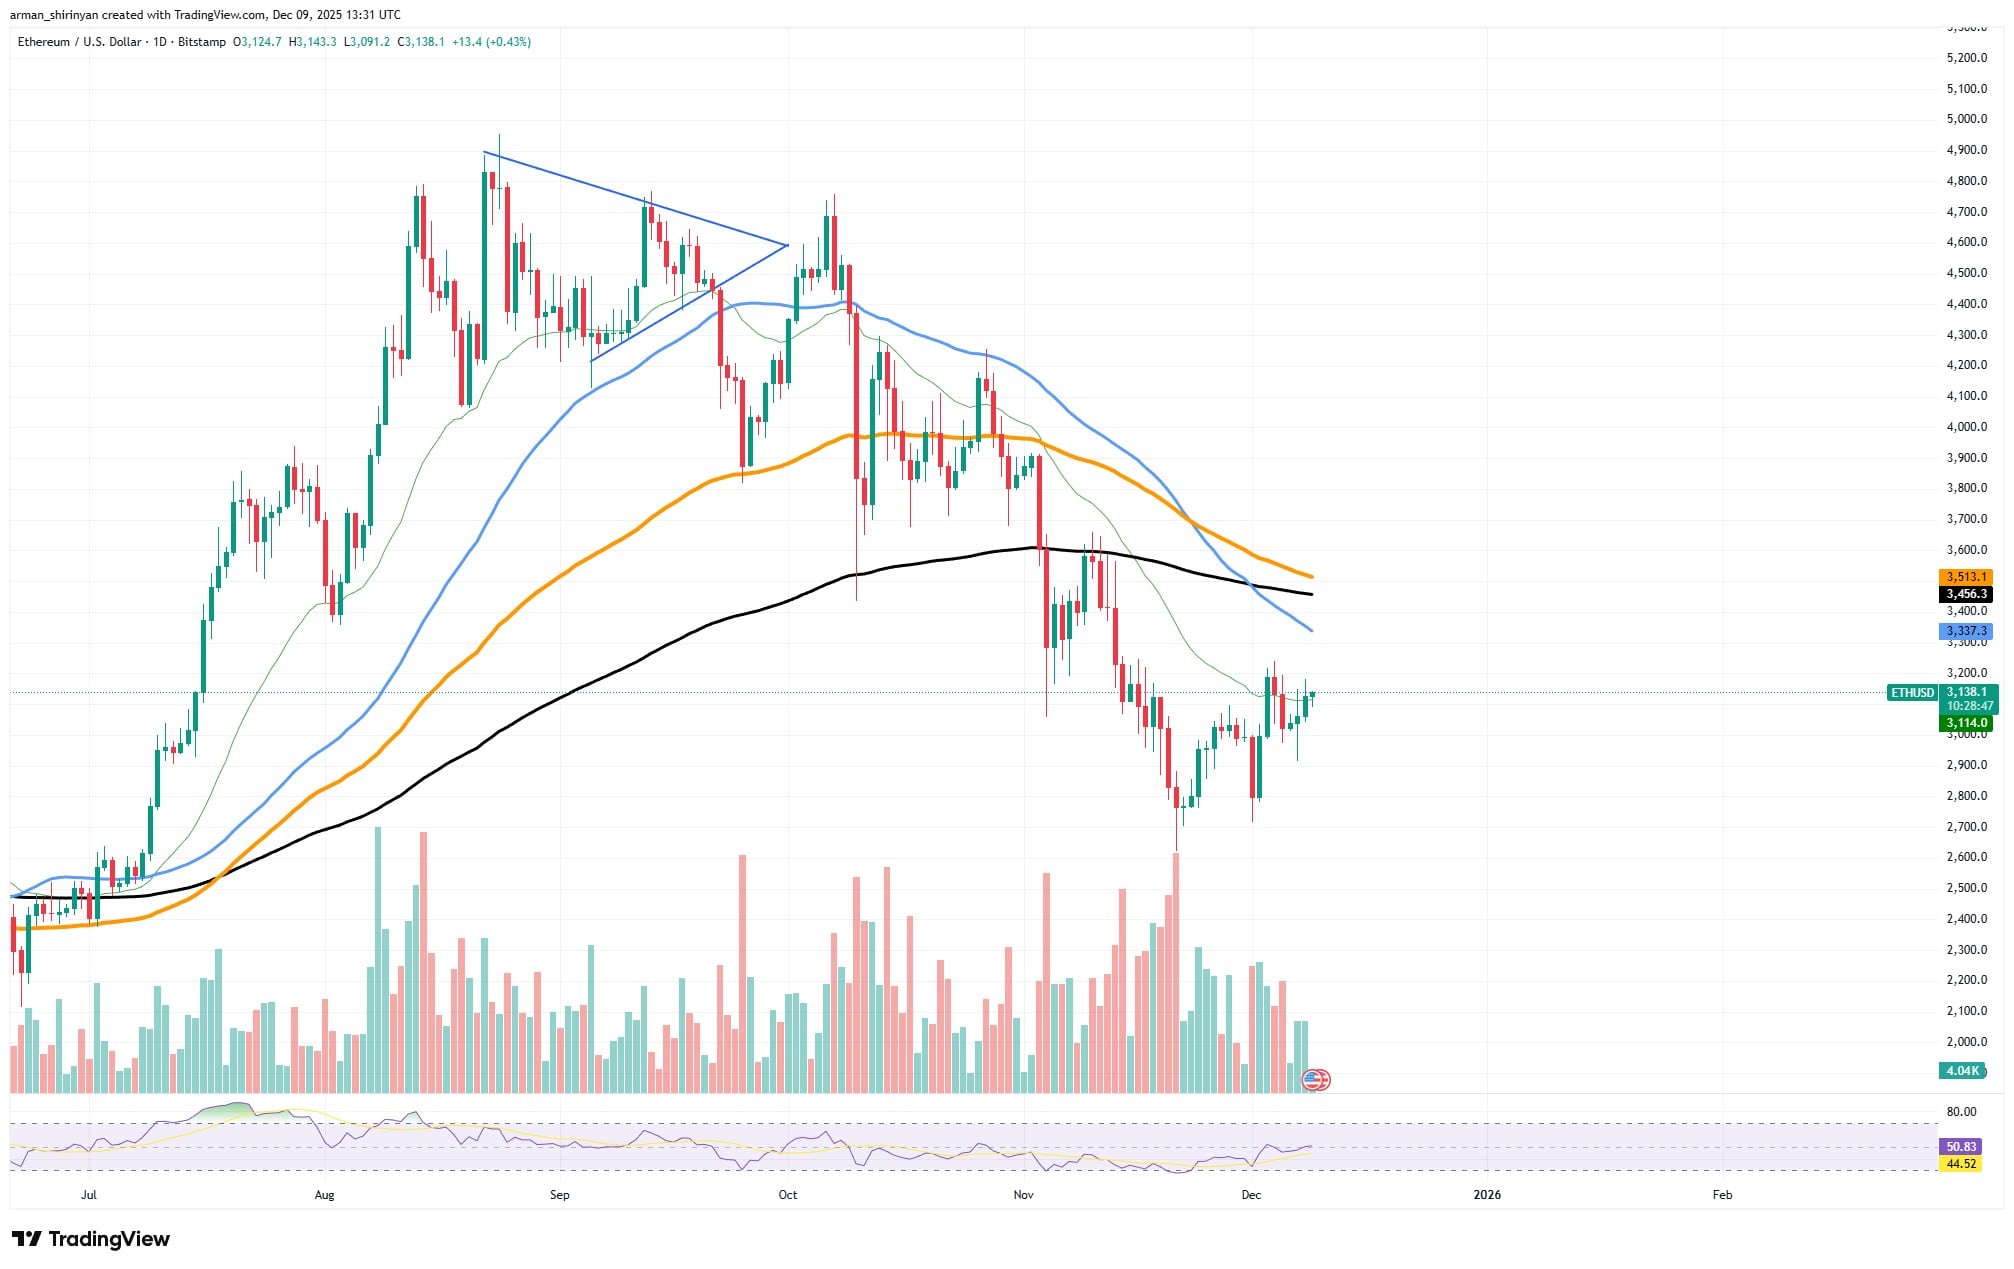
ETH has continuously printed higher lows over the last two weeks, exhibiting the type of structural recovery that usually comes before more significant trend reversals. The RSI has risen above the midpoint and entered the 50-55 range, indicating a return to strength without going into exhaustion territory. Additionally, volume has remained high during green candles, something the market had not witnessed during the sell-off in October, when buyers were mainly absent. They are now intervening early and forcefully.
More significantly, this enthusiasm extends beyond retail. Investors are reallocating into ETH at an increasing rate, according to data on capital inflow across markets. The broader sentiment shift, which is evident in spot accumulation, custody flows and derivatives positioning, suggests that the market is preparing for something more significant than a brief recovery. Dips are increasingly being viewed by investors as opportunities rather than cautions.
The overhead of the 50-day and 100-day moving averages is currently affecting ETH. This cluster creates a strong resistance area between $3,250 and $3,350, and ETH is effectively scorching it by repeatedly pushing into it and refusing to make a significant retreat. In most cases, assets that exhibit such behavior are getting ready to break through rather than fall.
The path toward the 200-day MA, and ultimately the mid-$3,700s, opens up swiftly if ETH breaks through this zone with a strong daily close. A wider recovery leg may be built upon the current wave of bullish conviction and ongoing inflows.
Shiba Inu's strong divergence
It matters that Shiba Inu is displaying one of the most obvious momentum divergences on its chart in recent months. After a protracted decline, the price has been moving sideways, but volume has fallen much more sharply than the price. A classic bullish divergence results from this disconnect: sellers are still pushing SHIB lower, but they are doing so much less forcefully. It is frequently the first indication that downside pressure is exhausting in markets like this.

The 50-day, 100-day and 200-day moving averages are all stacked overhead in bearish alignment, and SHIB is still pinned below a number of significant moving averages on the chart. That, in and of itself, indicates that the overall trend has not changed. However, the way prices behave in relation to those averages is changing. The asset has begun to form a series of higher lows while volatility decreases, rather than cascading lower. That is how the market subtly signals the end of the aggressive liquidation phase.
The important thing is volume. Every leg lower in October and the first part of November was accompanied by significant sell-side volume. Now, volume hardly changes when SHIB drops. The way sellers used to step in is no longer the case. A small but significant change in order flow that frequently precedes a base-building phase is evident on the few green days, which are exhibiting somewhat higher volume than the red ones.
Although it does not ensure quick profit, this divergence sets the stage for it. Because it requires less capital to move the market, a breakout attempt becomes more likely when price compresses and volume dries up. When you combine that with RSI rising and stabilizing in the mid-40s, SHIB appears more balanced than bearish.
XRP's structural shift
The structural indicators of a slowing downtrend are finally visible on XRP’s chart, and this time the evidence is difficult to ignore. The asset has been moving within a clearly defined downward price channel for months, printing lower highs and lower lows with mechanical accuracy.
However, the most recent price action clearly deviates from that pattern: buyers are intervening earlier and more consistently, and sellers are no longer able to force new lows. Now that the channel’s lower boundary has been tested several times, XRP is starting to hold higher lows rather than continuing downward cleanly. This, by itself, indicates that bearish pressure is waning, but it does not end there.

After spending months below that range, the RSI has stabilized in the mid-40s. This is a typical early momentum shift that frequently occurs prior to the conclusion of a trending decline. The market is slowly but steadily recovering; it is no longer oversold. Volume backs up this claim as well.
Volume in green candles is now surpassing the sales spikes that dominated October and early November, despite not being particularly explosive. This change in order flow indicates that buyers are subtly taking back control of markets where bears used to dictate every move.
The way XRP is currently interacting with the midchannel region may be the strongest indication that the downtrend is coming to an end. The price is beginning to consolidate directly beneath the declining resistance line rather than being forcefully pushed back. Assets that are getting ready for a breakout frequently exhibit this behavior, whereas assets that are getting ready for more downside rarely do. Even with moderate volume, the market is likely to interpret XRP’s break from the upper boundary of the descending channel as a trend inflection.
The heavier resistance zones at $2.40 and $2.47 would follow the 50-day moving average at $2.27 if such a move were to occur.
 Dan Burgin
 U.Today Editorial Team