Despite the price drop of Bitcoin SV against the total market correction, the asset has fixed in 8th place in the global ranking on CoinMarketCap. Besides the technical factors, there might also be some fundamental prerequisites that affected the 12% decline.
Vitalik Buterin, the creator of the Ethereum network, once again criticized the Bitcoin SV project, calling it fraudulent.

However, analyzing the more extended time frames, Bitcoin SV has rocketed by 100% over the previous 10 days. The main growth driver for Bitcoin SV was the emergence of the fake news that Craig Wright, who declared himself Satoshi Nakamoto, transferred funds from a Bitcoin address, which belongs to Satoshi Nakamoto, to Binance.
Now, let’s get to the chart to predict the rate of Bitcoin SV from the technical perspective.

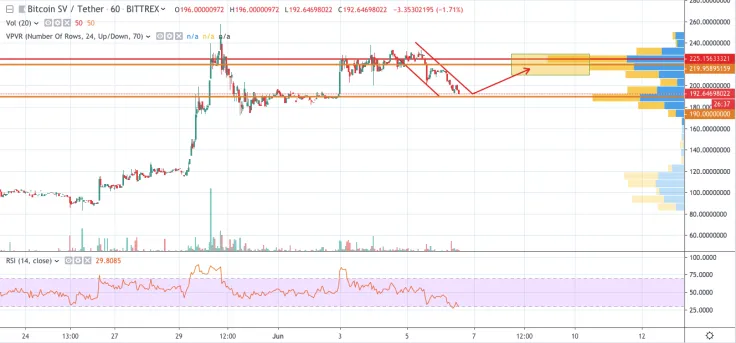
On the hourly chart, Bitcoin SV is looking bearish; however, it is not a surprise taking into the enormous growth days earlier. At the moment, the coin has been dominated by bears since June 4, and the current price does not look like the bottom. Supposedly, BSV might plummet to the support at $190 shortly. After that, one should not wait for a fast bounce back but rather consolidation in the yellow corridor of $210-$230.

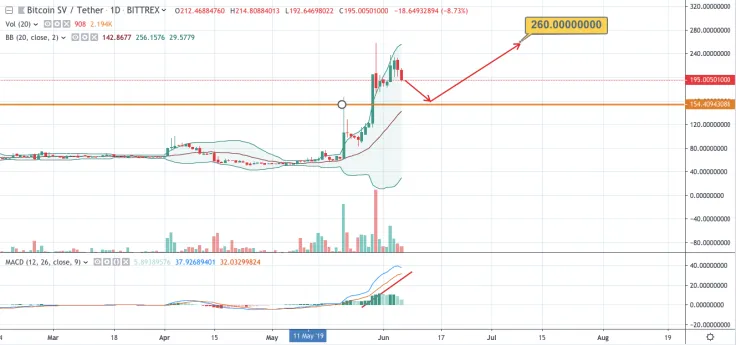
Compared to the hourly chart, Bitcoin SV is about to show growth on the 1-day graph. Such a statement is confirmed by the technical indicators and the increased trading volume. Concerning the first factor, the MACD pattern is looking upwards, reinforcing the upcoming bullish wave. The lines of the Bollinger Bands are also moving in the uptrend.
In this regard, the long-term idea is reaching $260 in July 2019.
The price of BSV is trading at $195 at the time of writing.

 Vladislav Sopov
 Dan Burgin