
Disclaimer: The opinions expressed by our writers are their own and do not represent the views of U.Today. The financial and market information provided on U.Today is intended for informational purposes only. U.Today is not liable for any financial losses incurred while trading cryptocurrencies. Conduct your own research by contacting financial experts before making any investment decisions. We believe that all content is accurate as of the date of publication, but certain offers mentioned may no longer be available.
Ethereum, Shiba Inu and Dogecoin are all facing pressure after recent pullbacks, but their technical setups suggest different paths forward. Ethereum looks the weakest, struggling near $4,000 with a risk of deeper losses if key supports fail. Shiba Inu is consolidating, showing limited selling pressure and room for recovery if buyers step in. Dogecoin, while also correcting, is holding stronger support levels and could stage a rebound if it regains short-term momentum.
Ethereum slips
Ethereum (ETH) has experienced a significant decline and is endangering the $4,000 mark. Weakness is indicated by the recent break from the symmetrical triangle pattern, as ETH moved sharply lower after failing to maintain its consolidation. Ethereum is currently trading close to $4,185, down more than 5% from the previous session.
Since ETH had been firmly consolidating for weeks and traders were anticipating an increase in volatility, the breakdown is noteworthy. Bulls were disappointed when the breakout turned bearish, confirming resistance at $4,600 and increasing selling pressure.
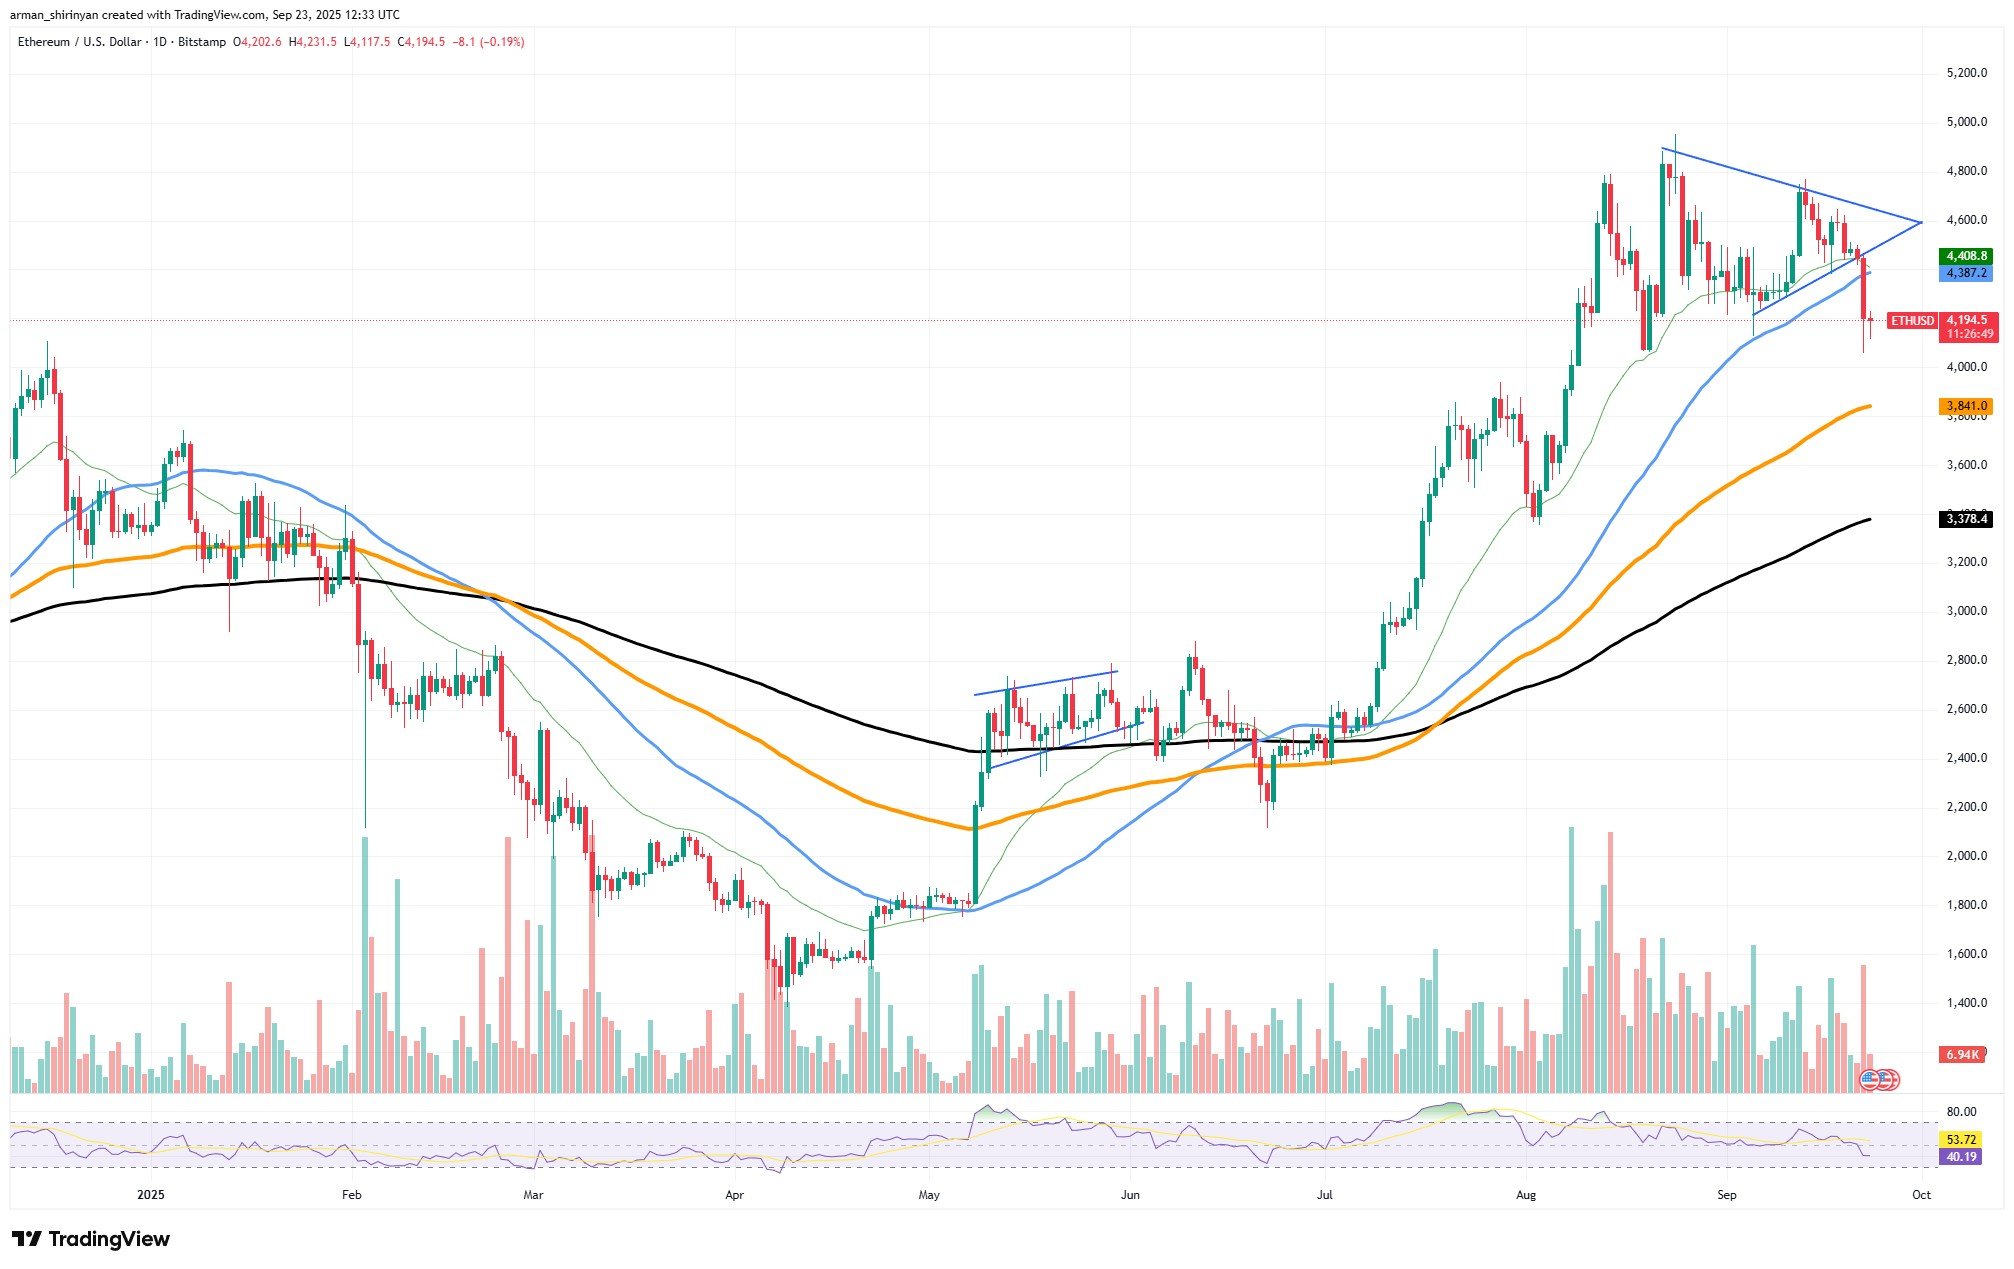
A mixed picture is being painted by the moving averages. After breaking through the 50-day moving average, ETH is now depending on the 100-day average, which is at $3,880, as the next important support. If that does not work, the 200-day average at $3,378 will turn into the main target for the downside, which could wipe out a large portion of the summer rally.
The recent red candles also saw a spike in volume, indicating that sellers are currently in charge. The Relative Strength Index (RSI) has entered bearish territory after falling below 40. This supports the notion that ETH is overshooting lower, but it might also point to the potential for a short-term relief bounce.
Ethereum runs the risk of plummeting if $4,000 is lost, testing the $3,800 support nearly instantly. Since $4,000 has been regarded as a psychological and technical anchor, failure at this level would result in a significant change in market sentiment.
Ethereum holders are currently facing a crucial time. Restoring confidence would require a bounce above $4,400, but the current momentum points further downward. It has never seemed more likely that ETH will lose $4,000 in recent weeks.
Shiba Inu's pressure
After briefly breaking below the symmetrical triangle that has been forming since the middle of the year, Shiba Inu is currently trading under pressure near $0.0000122. At first, the move appeared to be the start of a longer downtrend, but current circumstances indicate that there is still hope for a recovery.
Here, the absence of consistent selling pressure is the most crucial element. On-chain data shows no discernible increase in exchange inflows despite the recent decline, indicating that holders are not in a rush to sell their holdings. SHIB has the space to stabilize and possibly push higher in the near future due to the supply side’s relative calm.
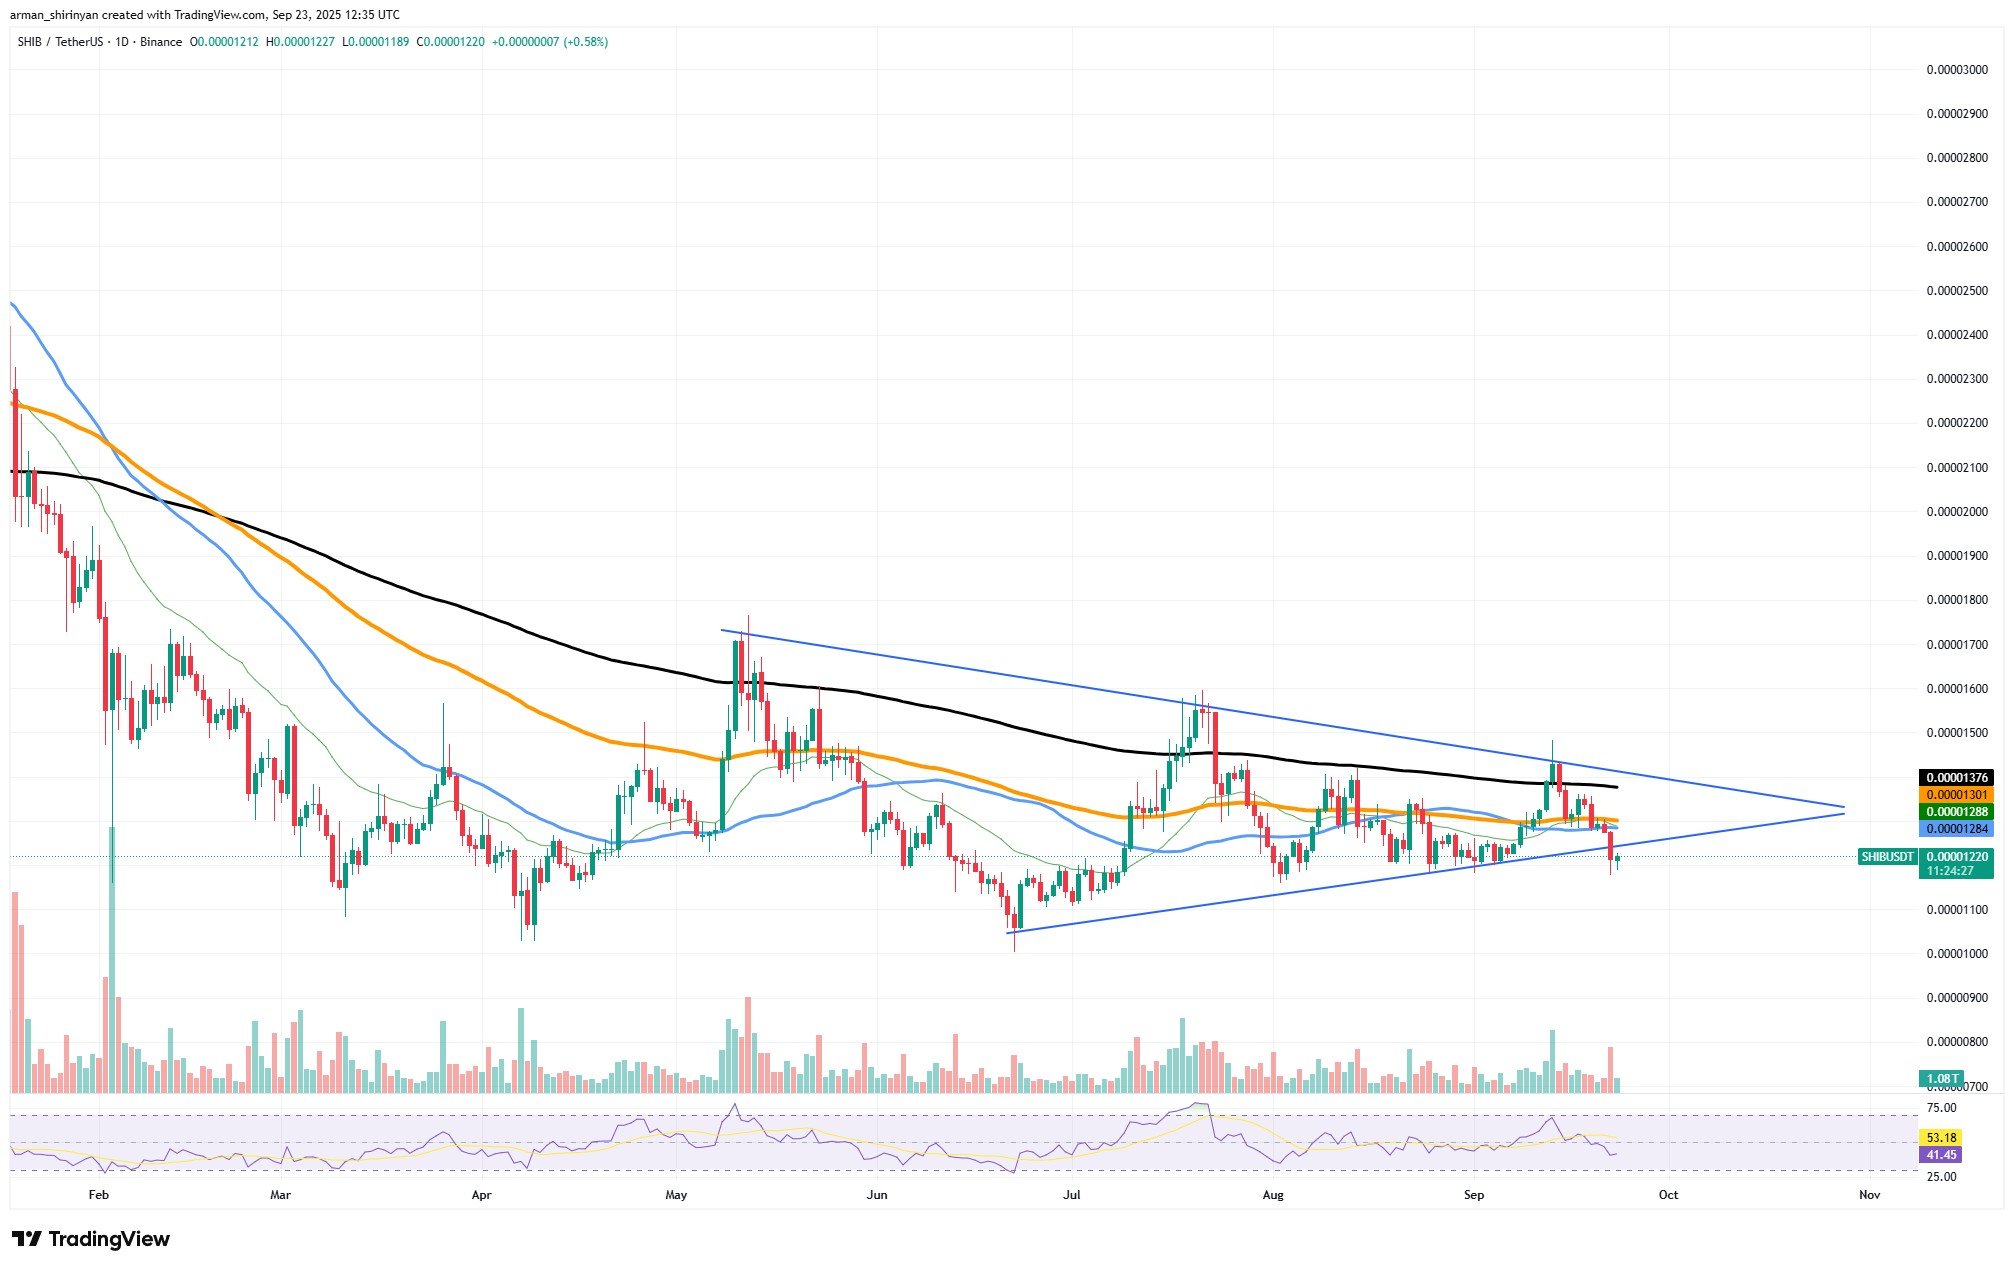
With the 200-day EMA continuing to serve as a broad support zone around $0.0000100, the daily chart displays SHIB consolidating between major moving averages. A sign that capitulation has not occurred is the recent red candles’ volume, which has not increased significantly. With SHIB regaining the $0.0000130-$0.0000135 range, the bulls may regain momentum.
At about 41, the Relative Strength Index (RSI) indicates that the market is somewhat oversold. As technical traders seek out reentry opportunities, this might serve as fuel for a brief recovery rally. Restoring general confidence would begin with a recovery into the $0.0000140 zone.
Even though it might seem far off, $0.000020 is still accessible if the market levels off in Q4. When demand increases, SHIB has historically demonstrated the capacity to move swiftly, and the lack of significant exchange selling lends credence to that theory.
In other words, Shiba Inus are still relevant today. There is still room for recovery, as there are no strong selling signals or technical indicators pointing to oversold levels. If buyers pick up steam again, $0.000020 remains a viable target.
Dogecoin's hidden strength
Dogecoin is currently trading at about $0.23, having experienced a significant decline after testing resistance at around $0.30. A major bullish card on the chart may position DOGE for a subsequent run toward $0.32, despite the decline initially appearing depressing.
DOGE recently dropped straight onto the 50-day Exponential Moving Average (EMA), which is serving as a critical support level at the moment. The current configuration raises the possibility that DOGE will use the 50 EMA as a launchpad for recoveries, as it has in the past. The larger bullish structure is unaffected as long as this level is maintained.
Trends in volume indicate that the selling pressure has not been particularly strong. Although there are more red candles, the intensity does not indicate a panic, allowing buyers to reenter the market. Furthermore, the market’s willingness to defend important price zones is indicated by DOGE’s higher lows, which show that it has not completely given up its summer gains.
The Relative Strength Index (RSI), which is currently at 45, is getting closer to neutral. This promotes the notion of a recovery bounce and lessens the chance of an overheated market. The path toward resistance at $0.28-$0.30 may open rapidly if DOGE can regain $0.25 in the near future. The price may eventually test $0.32 if there is a breakout from there.
It is important to note Dogecoin’s resilience in comparison to other assets. Its ability to maintain its trend above long-term averages, such as the 200 EMA, in spite of volatility indicates that its value base has not been lost.
 Dan Burgin
 U.Today Editorial Team