
Disclaimer: The opinions expressed by our writers are their own and do not represent the views of U.Today. The financial and market information provided on U.Today is intended for informational purposes only. U.Today is not liable for any financial losses incurred while trading cryptocurrencies. Conduct your own research by contacting financial experts before making any investment decisions. We believe that all content is accurate as of the date of publication, but certain offers mentioned may no longer be available.
The state of the market is not getting better, and lack of netflows confirm the negative outlook. Larger, less volatile assets see slower downslides, while smaller assets like Dogecoin tend to lose local support levels rapidly.
Dogecoin's death cross
A death cross formation, which is a bearish technical signal that happens when the 50-day moving average crosses below the 200-day moving average, has been officially confirmed for Dogecoin. This pattern has historically preceded times when major cryptocurrency assets have experienced prolonged downward momentum, and the timing of this event for DOGE could not be worse.
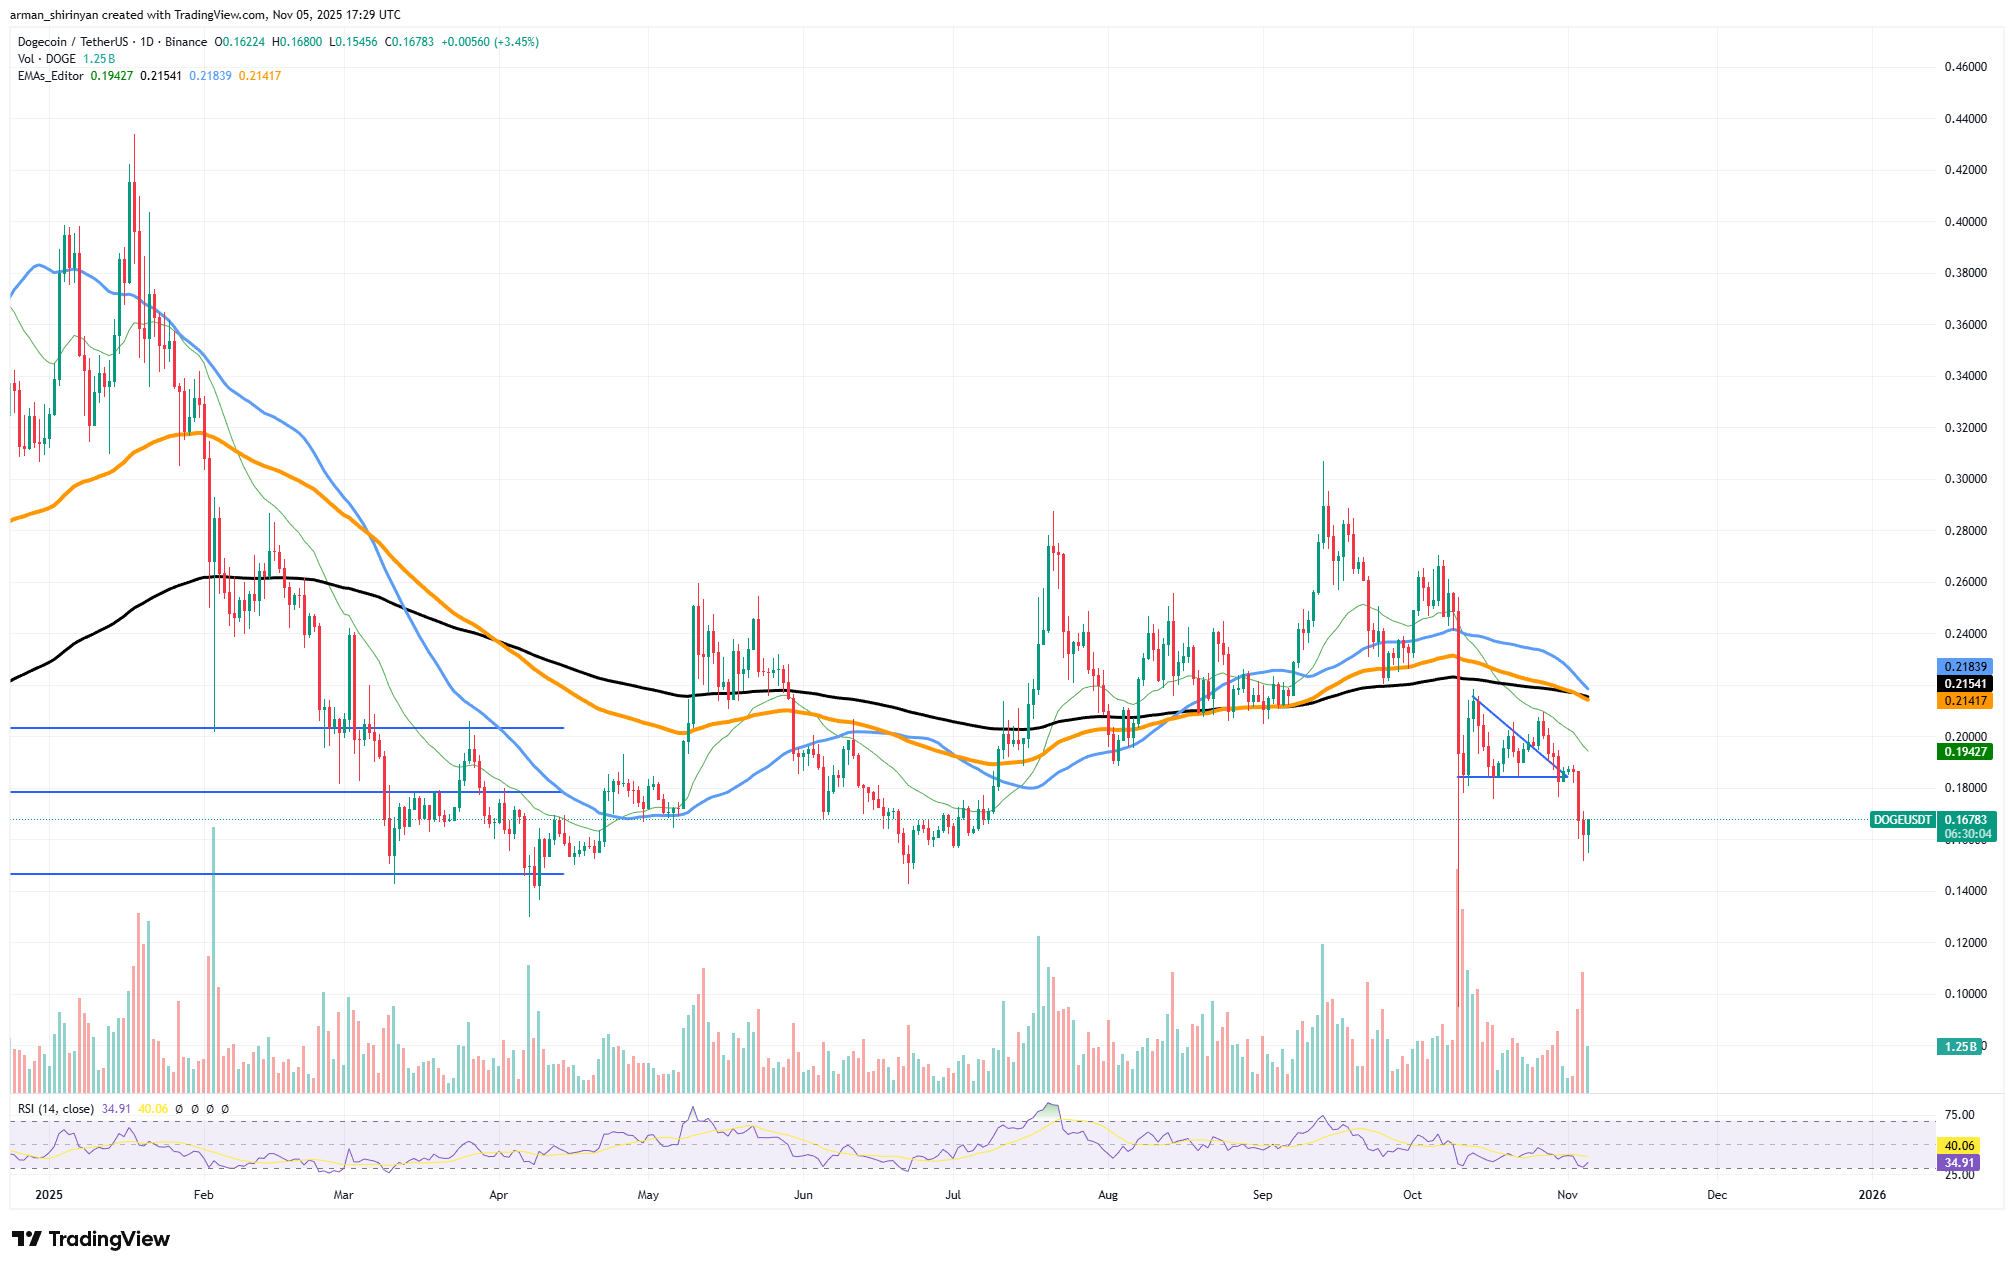
Since early September, the price of the coin has been steadily declining, and the confirmation of the death cross now confirms the monthslong bearish structure. DOGE is currently trading at about $0.165, a significant decrease from the local peak above $0.30 earlier this year. A deeper retracement is now possible due to the breakdown below the $0.18 support level, and the next strong demand zone is located between $0.14 and $0.15.
The market is getting close to oversold territory but is not yet at capitulation levels, according to momentum indicators like the RSI, which is currently at 39. This suggests that there may still be space for another leg down. A change in the market’s mindset is indicated by the death cross. This is likely to be interpreted as a sell signal by swing investors and short-term traders, increasing pressure as liquidity dries up.

As the price struggles to rise above important moving averages that have now become resistance barriers, long-term holders may experience increasing uncertainty. Bearish control will probably last until the end of 2025 unless Dogecoin can swiftly recover $0.20. The price may retest the $0.12-$0.13 range, which was last observed during the larger cryptocurrency correction earlier this year, if the current trend continues.
Although it is impossible to completely rule out speculative spikes motivated by social sentiment or Elon Musk’s influence, Dogecoin’s technical future is still bleak. Now that the death cross has been confirmed, DOGE investors should prepare for the possibility that the downward trend will continue before a significant reversal occurs.
Bitcoin enters correction
A potentially deeper correction phase is ahead of Bitcoin, which is currently engaged in a fierce battle against an overwhelming $500 million sell wall. The asset is having difficulty staying above the $100,000 psychological support level, and the larger market structure indicates that bullish momentum has completely faded, despite small intraday gains.
The sell wall, which is concentrated on major exchanges, has grown to be a powerful force that suppresses all attempts at recovery and absorbs buying volume. The magnitude of profit-taking and liquidation pressure from large holders, especially those who amassed in previous cycles around $90,000-$100,000, is highlighted by this volume imbalance. The likelihood of a significant market recovery is still low until this supply overhang is removed.

Technically speaking, the daily chart for Bitcoin presents a dismal image. For the first time since early 2024, the price has broken below the 200-day moving average, which is frequently seen as the beginning of a protracted downtrend after a bullish phase. The loss of medium-term momentum has also been confirmed by the 50-day and 100-day MAs, which have begun to curl downward.
The market is getting close to oversold territory, according to the RSI at 32.7, but even technical relief bounces are probably going to be fleeting due to the ongoing sell pressure. This pessimistic view is supported by the volume spike that accompanied the recent sell-off, demonstrating that panic and forced liquidations still dominate sentiment.
Bulls will stay on the sidelines unless Bitcoin can firmly recover $108,000, which is now resistance instead of the previous 200-day support. The short-term path of least resistance is downward. Even the next support levels, which are approximately $98,000 and $92,000, could be tested rapidly if the sell wall holds. The market is far from a sustainable recovery, as evidenced by Bitcoin’s battle against half a billion dollars in sell orders, which it is unlikely to win anytime soon.
Ethereum's stabilization point
After one of the worst corrections this year, Ethereum has at last found some stability. ETH is now exhibiting early indications of consolidation around a critical zone after a sharp decline that drove prices below the $3,600 mark. The $3,000 support level, which has historically functioned as a technical and psychological floor, has once again demonstrated its significance by stopping the forceful selling wave that started in mid-October. Now the question is whether this area can serve as a launching pad for recuperation, or if it is just a stop before putting another leg down.

ETH is still below its 50-day and 200-day moving averages on the daily chart, both of which have begun to slope downward, indicating a bearish technical signal. Nonetheless, the robust recovery from the $3,000-$3,100 range, along with a slight increase in buying volume, indicates that some accumulation among long-term investors may already be occurring.
As of press time, the RSI is at about 30.6, which puts Ethereum in extremely oversold territory. This has historically been a zone from which rapid, brief recoveries frequently take place. A relief rally back toward the $4,200-$4,300 resistance levels is a real possibility if the market can hold above $3,000 and recover $3,800-$4,000.
Technical and macro pressures, however, should not be disregarded. Ethereum would probably remain stuck in a protracted consolidation, or even be pulled toward $2,800 or less, if it consistently failed to rise above the 200-day moving average. To put it briefly, whether or not $3,000 holds steady will determine Ethereum’s potential for recovery. Further declines could occur if this level breaks, but if it holds, the market may begin a gradual, grinding recovery as it stabilizes into late 2025.
 Dan Burgin
 U.Today Editorial Team