Disclaimer: The opinions expressed by our writers are their own and do not represent the views of U.Today. The financial and market information provided on U.Today is intended for informational purposes only. U.Today is not liable for any financial losses incurred while trading cryptocurrencies. Conduct your own research by contacting financial experts before making any investment decisions. We believe that all content is accurate as of the date of publication, but certain offers mentioned may no longer be available.
For weeks, Shiba Inu's sideways movement provides nothing but unclear direction. However, a surprise rally might be closer than most people think, according to the current chart setup.
SHIB has been consolidating within a symmetrical triangle formation, a technical pattern frequently linked to strong breakout potential, which explains why SHIB has been trading between support and resistance levels that are progressively convergent since July. Right now, the price is firmly contained within the triangle, indicating a decrease in volatility and increasing pressure. Usually, a decisive action is taken when SHIB enters such compressionary periods. Importantly, SHIB is still adhering to both trendlines and hasn’t broken out of the formation. By itself, this maintains the potential for an upside breakout.
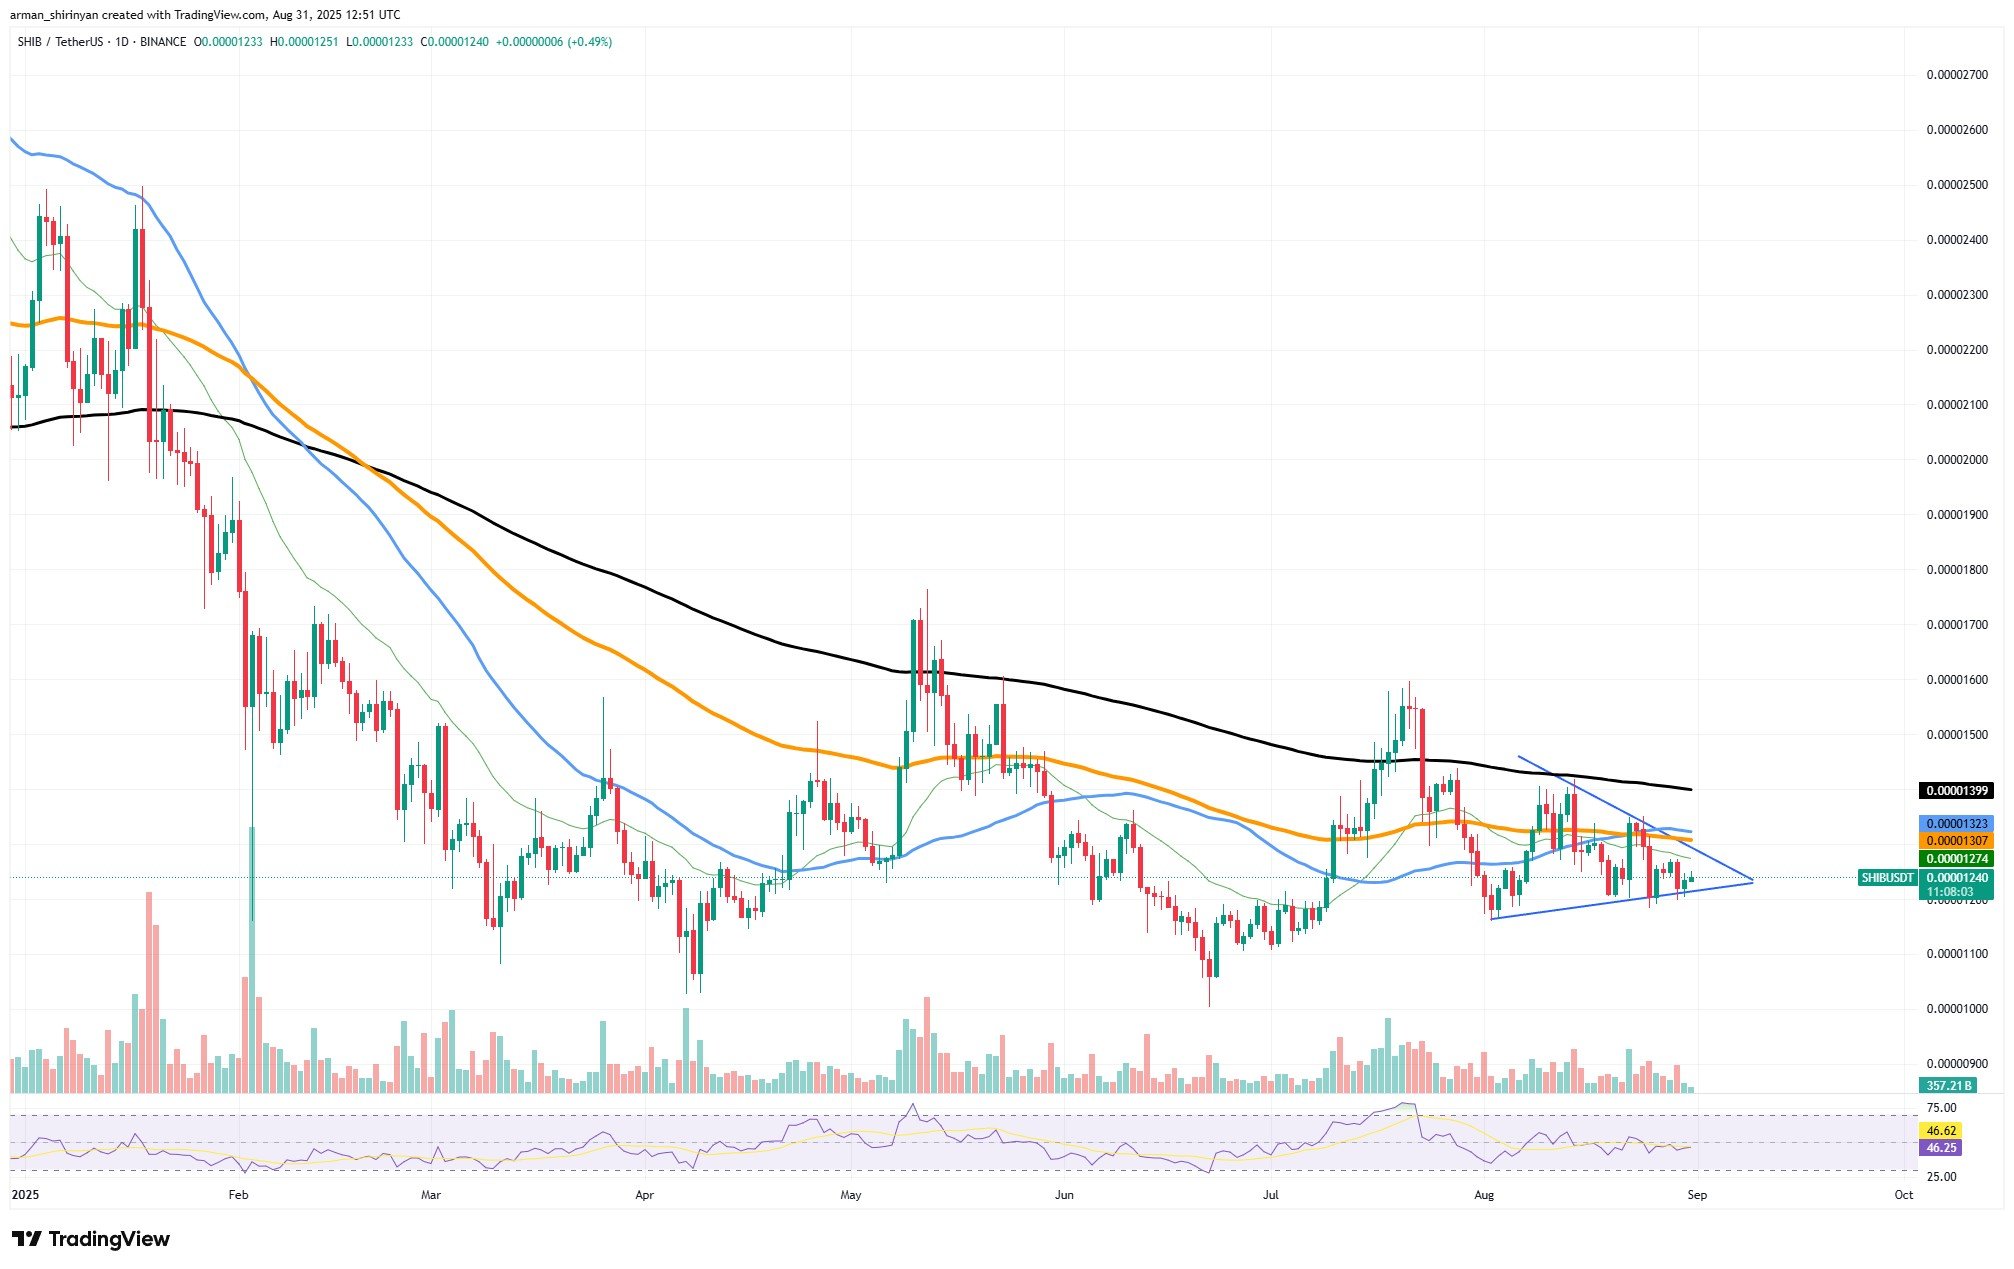
SHIB is still below important moving averages, such as the 200-day SMA, from a technical standpoint, indicating that the overall trend is still bearish. On the other hand, unexpected rallies frequently happen when traders least expect them and sentiment is low. Stop orders and short-term bullish momentum could be triggered by a clear break above the triangle’s upper boundary, which would push SHIB back toward resistance levels close to $0.0000130, and possibly higher if volume supports the move.
On the downside, SHIB runs the risk of retesting the $0.0000115 region if the triangle support is lost. The pattern’s price compression, however, indicates that the market is currently waiting for a trigger.
The main conclusion is that SHIB is still in its symmetrical triangle. The potential for an unexpected rally cannot be disregarded as long as it stays inside. Because the pattern is likely to move quickly once the breakout occurs, traders should closely monitor volume spikes and daily closes around its boundaries.
Bitcoin becoming bearish
Recent price movements for Bitcoin have rekindled concerns that the current bull market may be nearing its end. After testing resistance levels above $120,000 and continuing to rise for months, Bitcoin has now fallen below a crucial technical level: the 50-day exponential moving average (EMA). It is possible that the market is transitioning from a bullish phase to a longer bearish one as a result of this breakdown.
As a short- to midterm trend indicator, the 50 EMA has been used historically. Whenever the price gets close to the line, Bitcoin tends to bounce back and stay above it during strong uptrends. But the most recent move below this support, along with the low buying volume, indicates that the bullish momentum is waning.

The 200-day EMA, at about $104,000, which frequently serves as the boundary between bull and bear cycles, is the next key area to keep an eye on. Traders may perceive the beginning of a more significant correction if Bitcoin closes several sessions below the 50 EMA and is unable to swiftly recover it. Increased selling pressure would probably result from such a situation, with downside targets extending toward the $106,000-$104,000 range. A bear market would be even more strongly confirmed if the 200-day EMA were to break below.
The bull market isn’t quite over. In comparable configurations, Bitcoin has previously demonstrated resilience by regaining the 50 EMA and starting to rise again. The market is currently at a turning point: Either Bitcoin maintains its current levels and rises above the $113,000 resistance, or it runs the risk of plummeting as sentiment wanes.
XRP's summer rally ends?
The strong uptrend that propelled XRP earlier this summer may be coming to an end, as the token has formally broken down from its symmetrical triangle pattern. Bulls should be concerned about this technical breakdown, because triangles are frequently used as continuation or reversal setups. XRP’s failure to maintain support within the formation, in this instance, is bearish and may pave the way for further losses.
Not only has XRP fallen out of the triangle, but it is also perilously close to its 100-day moving average, at the moment trading around $2.81. The next important area, the 200-day moving average, is located at about $2.50 if this support fails. In the past, bullish and bearish market structures have been distinguished by this level. If there was a clear break below, more aggressive selling would probably follow.

There is a greater chance that XRP will fall closer to the psychological $2 mark if momentum keeps waning and it is unable to swiftly recover lost ground. Losing $2 would be a significant change in attitude and might undo a lot of the gains made in the previous few months. The most recent move was accompanied by declining volume, so there isn’t much proof that buyers are acting quickly to purchase at the current prices.
This breakdown, viewed more broadly, puts XRP in a vulnerable position. What was formerly a robust upward trend driven by bullish momentum may now turn into a longer-term downward trend. The outlook remains dominated by downside risks until XRP can rise back above $3.00 and invalidate this bearish move.
XRP’s technical structure has weakened, and a decline toward $2 or even lower is very likely unless there is a swift recovery. The market now awaits the conclusion of the rally, or the ability of bulls to hold onto key support areas.
 Dan Burgin