Disclaimer: The opinions expressed by our writers are their own and do not represent the views of U.Today. The financial and market information provided on U.Today is intended for informational purposes only. U.Today is not liable for any financial losses incurred while trading cryptocurrencies. Conduct your own research by contacting financial experts before making any investment decisions. We believe that all content is accurate as of the date of publication, but certain offers mentioned may no longer be available.
Having reached $0.30 level, XRP has stopped its growth and has been rejected again, which is not surprising for traders at all. Anyway, they hope that $0.30 retest will repeat soon and be more successful next time. What’s the chance of success? Let’s read XRP price predictions to find this out.
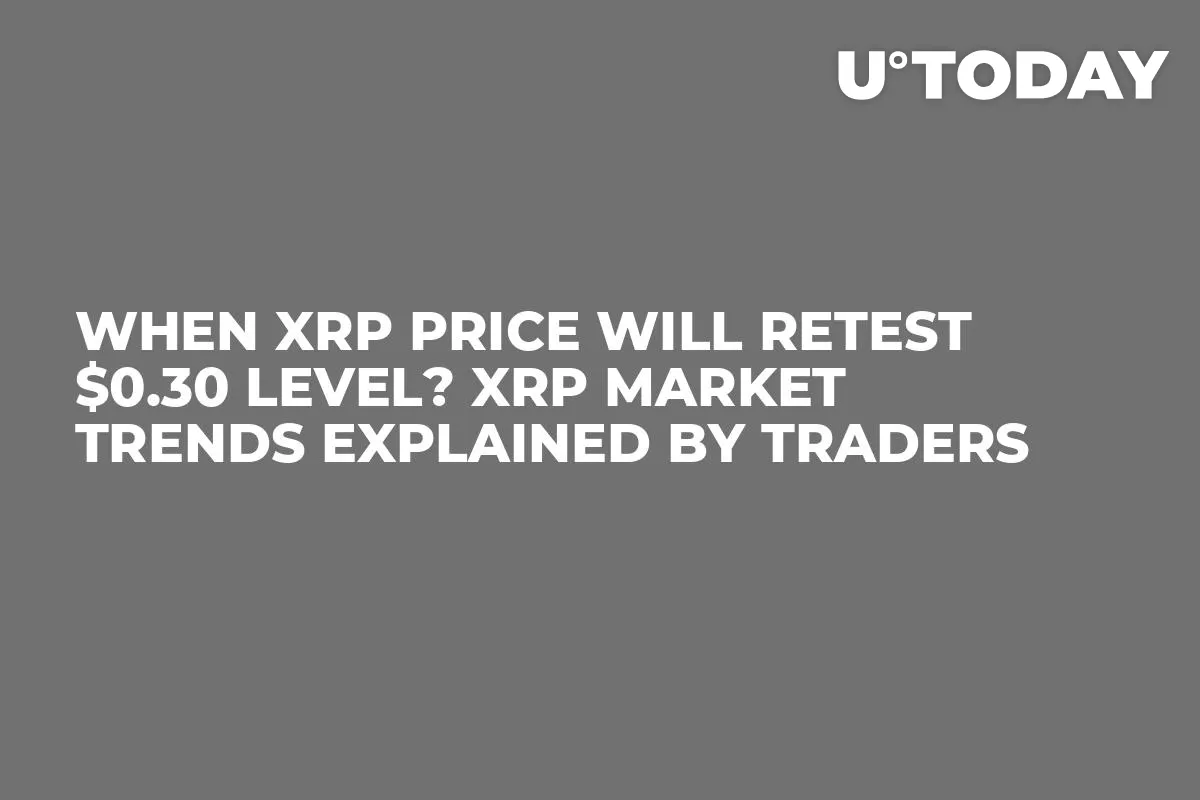
At the moment, Ripple’s XRP is sitting on weekly support. The next break and retest of this trend line will happen during the nearest days: this is when we can see XRP reach 35-36 cents.
What about the current technical indicators?
-
XRP has completed the 5 wave Elliot cycle and right now is moving in ABC corrective wave, from which we have developed a triangular formation.
-
The descending triangular formation which is developed right now has always been associated with lots of contradictions, coz this patterns could breakout either any side, that’s why traders need to wait for price confirmation and then make a decision.
Advertisement -
Fib382 around 0.25 has worked as a perfect support level from more than a year and still, bulls are strongly defending this support level, but things will remain critical unless we see a huge spike in prices and volume.
-
The major resistance for XRP is 21 weekly EMA sitting at 0.3 level break and weekly close above this level will surely confirm the next rally.

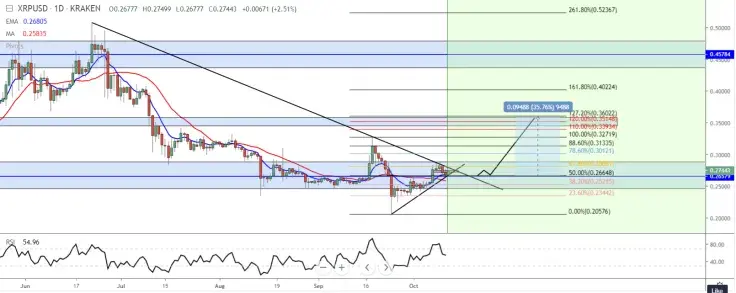
XRP/BTC will recover, too
What about XRP/BTC pair? On the chart from TradingShot, we can see the bullish proving that XRP/BTC is close to aggressively spike again. Besides the bullish divergence on the RSI, the price has completed almost 20 days above the 1D MA50, the first time it has done so since December 2018. All past such occurrences resulted in a strong bullish move. In a medium-term trade, we can take the profit once the 1D RSI hits 87.00 or 94.00 (though it’s quite risky).
 Dan Burgin