Disclaimer: The opinions expressed by our writers are their own and do not represent the views of U.Today. The financial and market information provided on U.Today is intended for informational purposes only. U.Today is not liable for any financial losses incurred while trading cryptocurrencies. Conduct your own research by contacting financial experts before making any investment decisions. We believe that all content is accurate as of the date of publication, but certain offers mentioned may no longer be available.
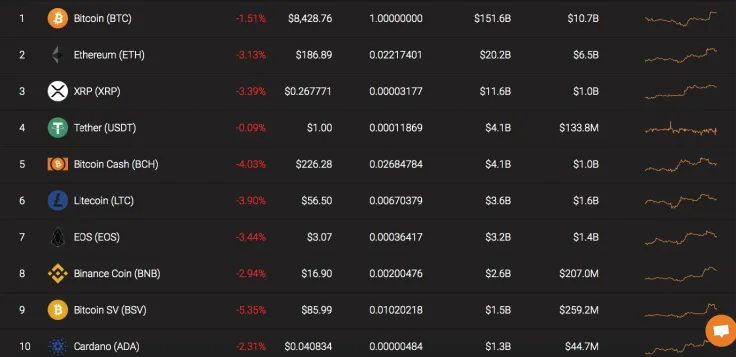
Yesterday Bitcoin reached $8,800 on some exchanges, however, that was a false breakdown. As it usually happens, the top coins followed the price movement of the chief crypto. Currently, all top 10 cryptocurrencies are located in the red zone. The biggest loser is Bitcoin SV whose rate has plummeted by more than 5% over the last 24 hours.

The key data of Bitcoin, Ethereum, and XRP are the following ones.
|
Name Morning Crypto Report: XRP to $126? Abnormal TV Glitch Reveals Ultimate XRP Price Target, Bitcoin to $25,000: Legendary Trader Brandt Reveals Brutal Timeline, Shiba Inu Unlock Hits 41,128,246,331 SHIB on Major Exchange
Ex-Ripple CTO: ‘Rational People’ Don’t See $100 XRP Yet
Crypto Market Review: Shiba Inu (SHIB): Are There Any Chances? Is XRP Eyeing $1.50? Bitcoin (BTC) Under Bearish Control
U.Today Crypto Digest: Ripple Exec Confirms XRP as Priority, Shiba Inu (SHIB) Price Eyes 10% Spike, Fidelity Launches RLUSD Competitor on Ethereum
|
Ticker Advertisement
|
Market Cap |
Price |
Volume (24h) Advertisement
|
Change (24h) |
|
Bitcoin |
BTC |
$152 265 300 812 |
$8 465,81 |
$19 559 084 744 |
-1,51% |
|
Ethereum |
ETH |
$20 395 807 362 |
$188,68 |
$9 163 209 270 |
-3,13% |
|
XRP |
XRP |
$11 697 139 884 |
$0,270975 |
$1 435 736 893 |
-3,39% |
BTC/USD
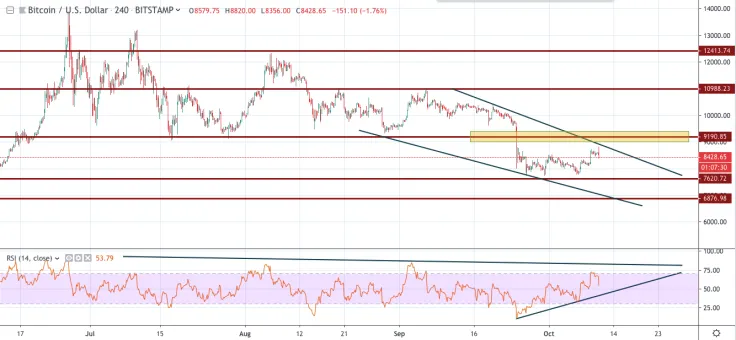
Our previous Bitcoin prediction is coming true, as the price is coming back to the previous support at $8,200-$8,300. Buyers tried to provoke the growth of the cryptocurrency market, however, that was just another correction before an ongoing decline to move down. The pressure from the bears has not weakened.

On the 4H chart, Bitcoin remains trading within the downward channel. However, the price is unlikely to drop fast to the area below $8,000.
An additional signal, in this case, will be a test of the trend line on RSI. Earlier, one already observed regular price rebounds and a drop in quotations at the moment when the indicator values reached the level of 75. Now the values are located near the level of 50, so the current area does not look interesting in favor of falling directly from current levels.
However, if bulls do not manage to reach $9,000 in a few days, BTC will drop to $7,600.
Bitcoin is trading at $8,435 at press time.
ETH/USD
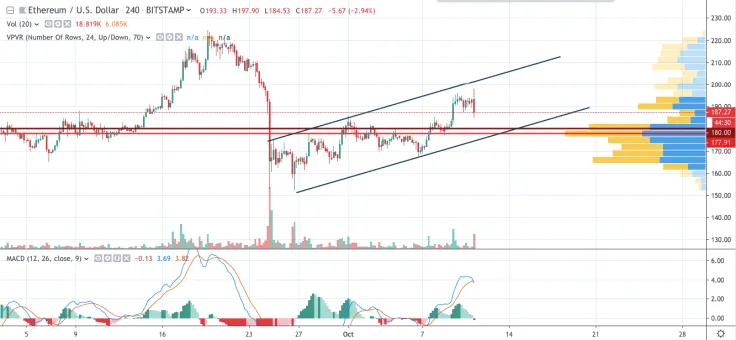
Bulls could not get Ethereum to the psychological level of $200. Currently, the coin is about to face a correction after an uptrend movement started from September 26.

According to the chart, the blue line of the MACD indicator crossed the red one, suggesting the price decline to the closest area at $180. The high index of selling volume also supports the upcoming drop. In this case, Ethereum is likely to reach $180 until mid-October.
Ethereum is trading at $186.74 at press time.
XRP/USD
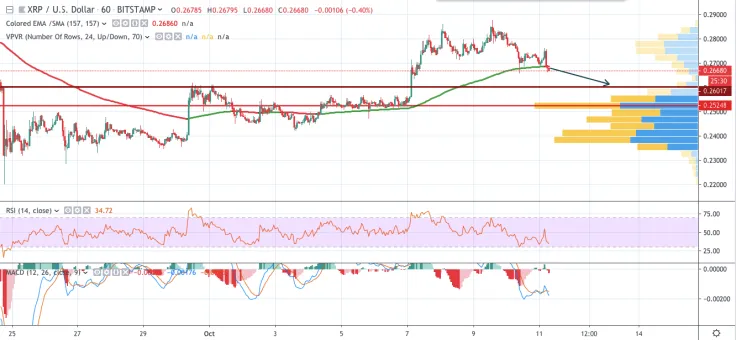
Yesterday, bears did not give a single chance for buyers to test the target mark of $0.29. They rolled back a pair below the average price level and set a local minimum at $0.266.

On the 1H chart, XRP is forming a reversal figure. The RSI indicator has not reached yet the oversold area, confirming the possible decline.
The colored EMA/SMA line changed to the red color which means the dominance of sellers on the market. In a short-term scenario, the coin will reach $0.26 until October 14.
XRP is trading at $0.2668 at press time.

 Gamza Khanzadaev
 Caroline Amosun
 Arman Shirinyan
 Godfrey Benjamin
 Yuri Molchan