
Disclaimer: The opinions expressed by our writers are their own and do not represent the views of U.Today. The financial and market information provided on U.Today is intended for informational purposes only. U.Today is not liable for any financial losses incurred while trading cryptocurrencies. Conduct your own research by contacting financial experts before making any investment decisions. We believe that all content is accurate as of the date of publication, but certain offers mentioned may no longer be available.
Crucial changes have occurred on the cryptocurrency market over the last 3 days. If two days ago, Bitcoin traded above $8,200, today, its rate is not even above $8,000. Most altcoins have followed BTC’s price movements. Earlier Bitcoin SV was the biggest gainer, however, today, its rate has dropped by more than 8%. All the top 10 coins are in the red zone.
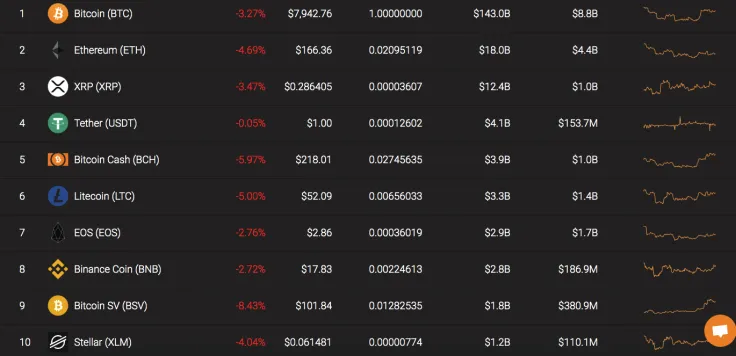
Take a look at the main parameters of the top 3 assets.
|
Name
Crypto Market Review: XRP in Deep $1 Waters, Shiba Inu (SHIB) — Worst Price Nosedive of 2026, Is Bitcoin (BTC) in Danger of Hitting $50,000?
Strategy's Saylor Hints at Fresh Bitcoin Buy Amid Investor Ridicule
Shiba Inu Buyers Step In, Peter Brandt Reveals Bitcoin Price Rebound Target, Ripple Exec Confirms XRP as Priority — Top Weekly Crypto News
Morning Crypto Report: XRP in -77% Breakdown Danger, Massive 100,000 ETH Binance Dump by Satoshi-Era Bitcoin Whale, Cardano's Forgotten +25% February Wins
|
Ticker Advertisement
|
Market Cap |
Price |
Volume (24h) Advertisement
|
Change (24h) |
|
Bitcoin |
BTC |
$143 798 804 615 |
$7 985,22 |
$17 194 331 733 |
-3,20% |
|
Ethereum |
ETH |
$18 116 177 483 |
$167,34 |
$7 380 111 204 |
-4,60% |
|
XRP |
XRP |
$12 432 303 444 |
$0,287501 |
$1 530 795 742 |
-3,49% |
BTC/USD
Even though Bitcoin formed a ’Golden Cross’ on the 1H chart, the leading cryptocurrency was unable to fix around $8,200. In this regard, our earlier Bitcoin price prediction came true as bears rolled the rate back to the zone where the quotes had been trading before.
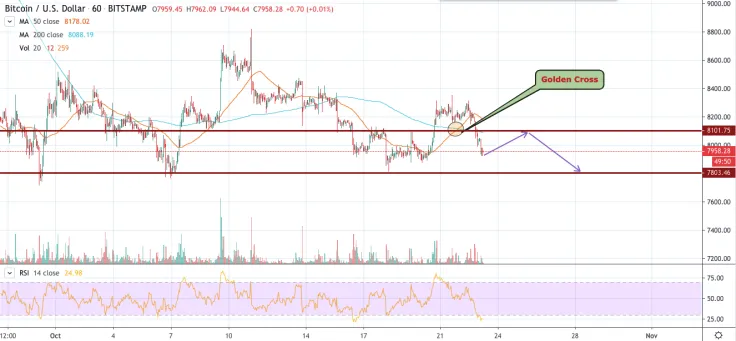
On the small timeframe, bears have nothing to sell based on the RSI indicator. This might be the signal of a slight bounceback after a sharp drop by more than $200. However, bears even strengthened their positions after a false growth.
One can conclude, that BTC will hardly be trading above $8,000 until the end of October.
Bitcoin is trading at $7,960 at press time.
ETH/USD
The leading altcoin simply kept up with the BTC’s decline. As it usually happens, altcoins are more volatile against Bitcoin.
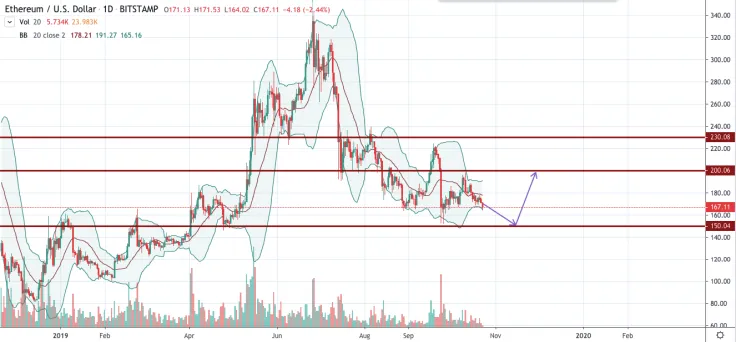
Ethereum is testing the vital support level around $165 which has been as a bounce point since the end of August. An upward turn from this area completed the correction which started earlier from the strong resistance level of $200. Moreover, the Bollinger Band indicator confirms this statement.
The 2nd most popular crypto is expected to continue its growth and going to test the next resistance level at $200 (the top of the previous impulse wave).
Ethereum is trading at $166.87 at press time.
XRP/USD
XRP could not rise against the fall of other coins as it did earlier. Its rate has gone down 3.50% over the last day. But it has almost unchanged over the week - the decline has made up only 0.03%.
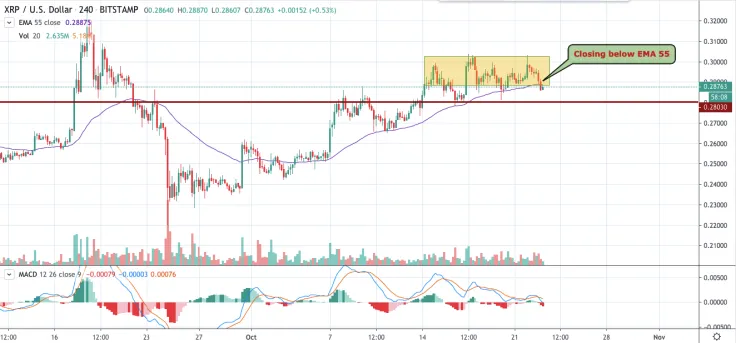
XRP has been in a sideways trend since October 14. However, the last candle was bearish, having closed below the four-hour EMA55. This is a signal of a further short-term decline. Besides, other indicators, such as MACD and the trading volume index, also show a price drop.
XRP is trading at $0.2876 at press time.

 Arman Shirinyan
 Alex Dovbnya
 Denys Serhiichuk