
Disclaimer: The opinions expressed by our writers are their own and do not represent the views of U.Today. The financial and market information provided on U.Today is intended for informational purposes only. U.Today is not liable for any financial losses incurred while trading cryptocurrencies. Conduct your own research by contacting financial experts before making any investment decisions. We believe that all content is accurate as of the date of publication, but certain offers mentioned may no longer be available.
The market looks unstable as the biggest assets here are not trading against important support zones and are essentially in a freefall mode that enables the massive possibility for rapid-paced reversals. The only thing needed for such a bearish scenario is a bit of selling pressure from institutional investors or whales.
No safety net for XRP
Following the loss of the 100-day EMA, one of its most crucial technical levels, XRP looks to be about to go into a possible freefall. The asset has now decisively closed below this moving average, indicating that bearish pressure is starting to take control once more after holding above it for weeks.
XRP has dropped more than 2.5% in the past day, breaking through both its short-term trendline and the 100 EMA support, and is currently trading close to $2.80. Previously serving as a stabilizing factor in the $2.85-$2.87 range, the moving average has now become resistance. Comparable breakdowns have historically preceded steep sell-offs, particularly when they are accompanied by low-volume rebounds and waning momentum, both of which are evident in the current configuration of XRP.
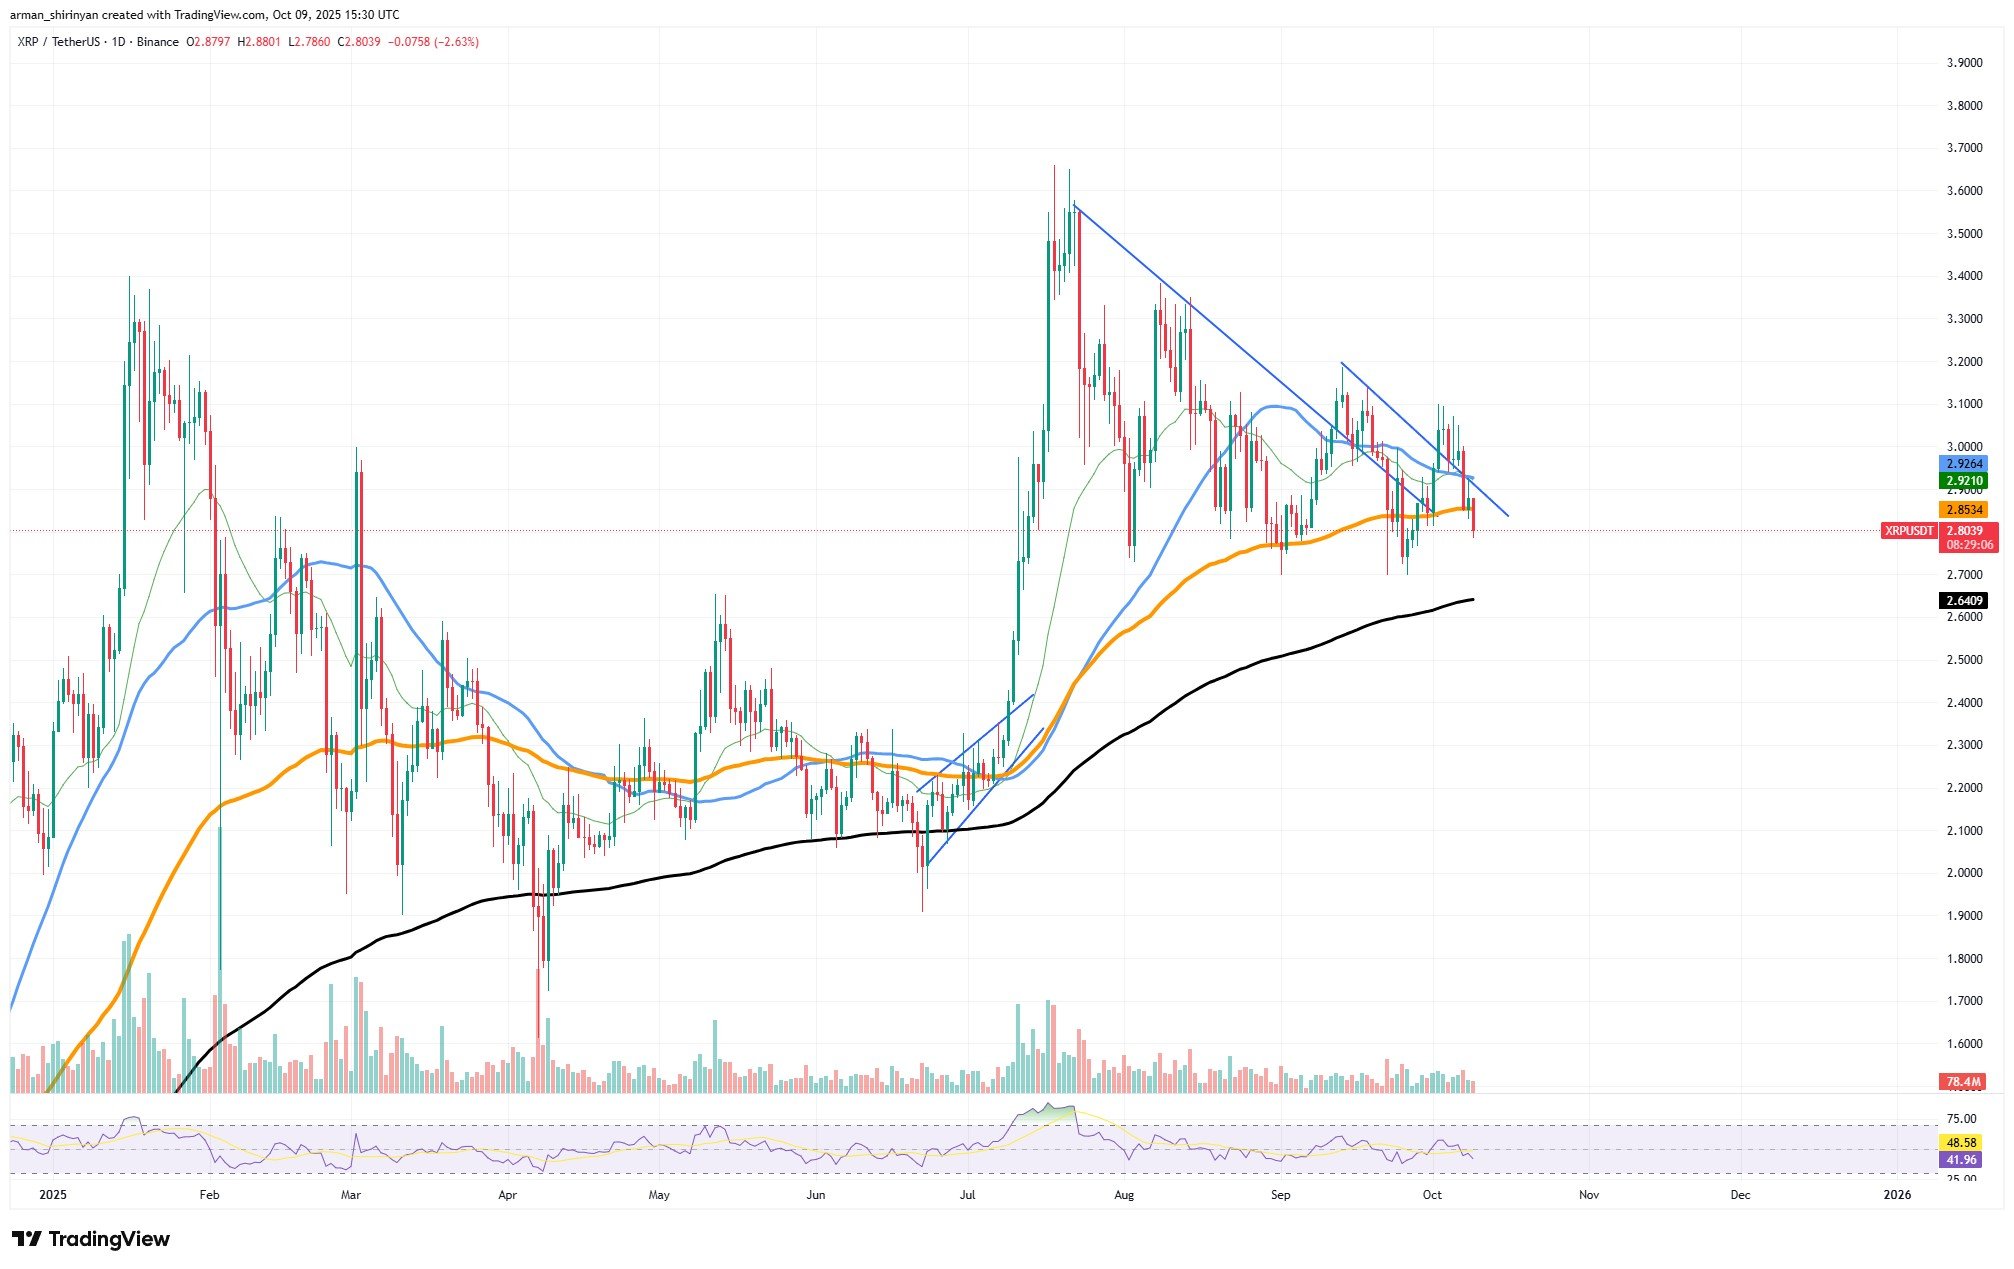
The daily chart’s technical structure presents a bleak picture. The asset has shown a pattern of lower highs and frequent rejections, as it has repeatedly failed to break above its descending resistance line. The 200-day EMA, which is currently trading at about $2.64, is the next significant support level and might be the final obstacle before a more significant correction.
If XRP is unable to hold steady above this level, a decline toward $2.50 or even $2.30 may occur very soon. Further raising concerns is the muted volume, which suggests that traders lack buying conviction. There may be more downside before oversold conditions are reached, according to the RSI, which is currently at 48 and shows neutral but waning momentum.
The technical posture of XRP is weak, to put it briefly. A significant bearish signal, losing the 100 EMA, puts the token at risk of experiencing an accelerated decline unless it quickly recovers. This controlled pullback could become a full-scale freefall if the 200 EMA is not held in the next few days.
Bitcoin peaks out
The most recent rally in Bitcoin seems to have peaked, with $120,000 emerging as the most likely local peak. The market may be cooling down instead of getting ready for a breakout toward higher targets like $150,000, as evidenced by the bullish momentum that has started to stall after an explosive move that propelled Bitcoin from the $113,000 range to over $124,000.
Bitcoin is having trouble maintaining its upward momentum, as the daily chart demonstrates. A classic indicator of diminishing buying power and rising profit-taking is the asset’s repeated printing of candles with long upper wicks. The 20-day EMA provides strong support, but the lack of follow-through volume suggests that traders are reluctant to push the rally higher. The RSI, which is presently close to 60, supports this opinion.
Although Bitcoin is not technically overbought, it is evident that a large portion of the short-term bullish energy has already been used up by the previous parabolic impulse. A sideways consolidation or a corrective phase has historically been preceded by such setups, particularly when rallies take place without adequate volume support.
Critical supports are located around $117,000 below the current level, followed by the 50-day EMA at $114,000 and the 100-day EMA at $113,000. In the next leg, the price of Bitcoin may revisit the $107,000-$108,000 range, a crucial region where the 200-day EMA offers structural support if it closes below these levels.
Although the long-term macro outlook for Bitcoin is still bullish, the short-term technicals indicate that the rally may have peaked for the time being. It does not seem likely that the $120,000-$125,000 range will be broken without a clear catalyst or volume growth. For the time being, $120,000 appears to be the peak — and a possible turning point where the market pauses before making a significant decision.
Shiba Inu descent continues
The significant turning point in Shiba Inu’s protracted and agonizing downward trend may finally be approaching. After months of consolidation within a tightening symmetrical triangle, the meme token now looks to be approaching a possible yearly bottom at $0.0000115, a level that has historically served as strong support and has never been decisively breached.
The bulls are still having trouble regaining momentum, as SHIB has once again failed to maintain gains above the 100-day EMA, currently trading at about $0.0000120. Its gradual decline toward its long-term support zone, however, might actually pave the way for a bullish reversal. SHIB’s multi-month formation’s ascending lower boundary and a region where previous rebounds have sparked notable price recoveries are both represented by the $0.0000115 level.
Technically speaking, this combination of diagonal and horizontal support indicates that SHIB is getting close to downside exhaustion. The RSI is circling 44, indicating that sellers are losing ground, and volume has been declining steadily. In addition to maintaining the overall structure, a recovery from this region might act as the foundation for a medium-term bullish reversal, which might target $0.0000130 and then the 200-day EMA close to $0.0000135.
The situation might rapidly worsen, though, if SHIB is unable to maintain the $0.0000115 level. Investor confidence would be seriously damaged if there was a confirmed break below it, which would render the bullish structure invalid and possibly pave the way to new 2025 lows.
Right now, everyone is focused on this vital support area. The start of a long-awaited recovery phase and a new bullish cycle for one of the most closely watched tokens in cryptocurrency could occur if SHIB is able to successfully defend its annual bottom.
 Dan Burgin
 U.Today Editorial Team