Disclaimer: The opinions expressed by our writers are their own and do not represent the views of U.Today. The financial and market information provided on U.Today is intended for informational purposes only. U.Today is not liable for any financial losses incurred while trading cryptocurrencies. Conduct your own research by contacting financial experts before making any investment decisions. We believe that all content is accurate as of the date of publication, but certain offers mentioned may no longer be available.
Despite the negative outlook on the market in the past, there is a good possibility that things will normalize sooner than anticipated as XRP and Solana land on longer-term support, with the possibility of a rapid reversal at around these levels.
Ethereum ready
The market is beginning to sense that Ethereum is getting closer to one of the most significant inflection zones on its higher-time-frame chart. The $3,000 level is a structural pivot that has consistently determined whether ETH trends higher or returns to consolidation. It is not just another round number.
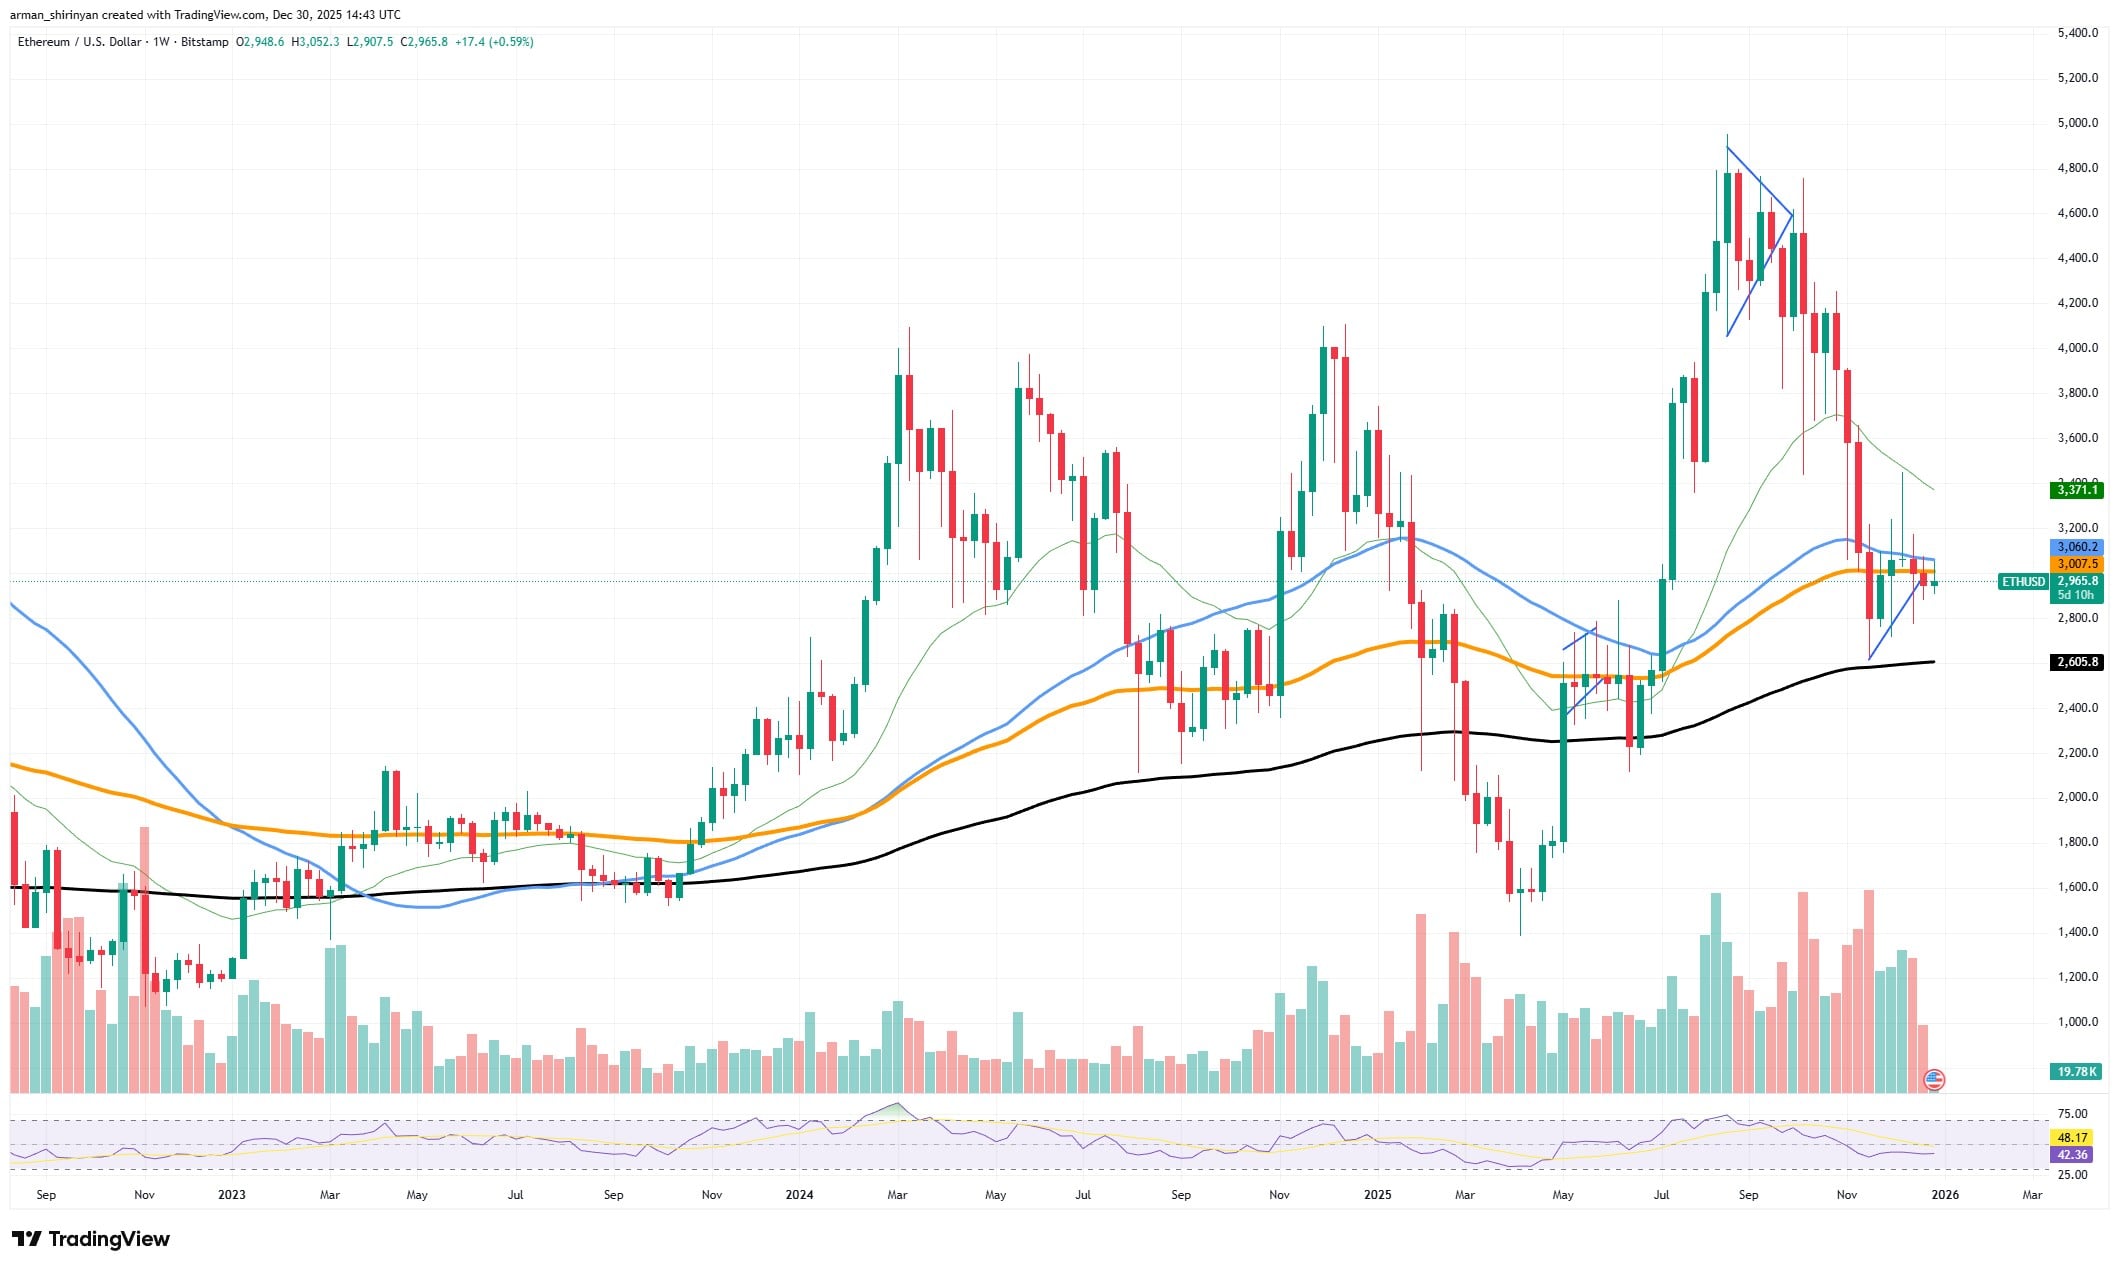
ETH is currently compressing around the mid-$2,900s, hovering just under $3,000 following a turbulent year. After a strong upward impulse earlier in the year, the price has cooled off, but the decline has been managed rather than catastrophic. It is important. With the 200-week moving average remaining below price and continuing to rise, ETH is still trading above its long-term trend support.
That is not bear market behavior. The level of $3,000 serves as both resistance and validation from a technical standpoint. Above it, Ethereum typically draws rotational capital from Bitcoin ETF-style allocation and momentum traders. Below it, ETH frequently becomes stuck in multiweek ranges and has historically struggled to maintain upside. The current positioning around this level is crucial because of this.
The way ETH is developing at the moment is noteworthy. During the decline, volume has decreased, indicating profit-taking rather than panic-selling. The weekly time frame RSI has stabilized in a neutral zone after resetting from overheated conditions, allowing ETH to move freely once more. In addition, rather than breaking through important moving averages, the price is coiling between them.
The risk scenario is simple to understand. The price of ETH may return to the low $2,700's or even test deeper support if it decisively loses the $3,000 area and is unable to swiftly regain it. That would reinforce range-bound conditions into the new year and postpone any sustained upward narrative.
The bullish situation depends on acceptance. The structure returns to expansion mode if Ethereum is able to retrieve $3,000 and retain it as support. Once this level is reached, ETH typically does not stay there for very long because volatility rises and follow-through usually happens fast.
XRP calming down
On the chart, XRP has reached a point where results begin to diverge significantly. The price is currently directly in a long-term weekly support zone, which has historically determined whether XRP stabilizes or moves further into correction following months of volatility and a steady decline from its local highs.
More important than any temporary recovery is this level. From a price-performance standpoint, it is evident that XRP has stabilized. Earlier in the year, the asset rolled over into a declining structure after failing to maintain momentum above the $2.50-$3.00 range.

Momentum indicators waned, volume decreased and lower highs were regularly formed. Most of that phase has now been finished. There is testing going on right now, not expansion. The weekly support zone slightly below $2 is the crucial recovery point. This region corresponds to previous consolidation ranges and long-term moving averages that served as launch points rather than breakdown zones.
Crucially, rather than cutting through it, price is responding at this level. Selling pressure is no longer increasing, wicks are developing and downside follow-through is restricted. That is a significant change. Confirmation is what investors should be looking for, not fireworks. The structure shifts from downtrend to base-building if XRP is able to maintain this weekly support and start regaining short-term resistance levels.
This indicates that the market begins to absorb supply rather than reject price, but it does not imply immediate upside. In the past, XRP recoveries have started in precisely this manner: slowly, uneasily and easily dismissed. The risk situation is still present. The recovery thesis would be refuted and a deeper retracement toward the long-term trend average would be possible if there was a clean weekly close below this support.
Long-term Solana support
At this point in 2025, Solana is arguably at its most significant technical level. The price has retreated into the $120 area, which is consistent with long-term weekly support and has typically served as a launchpad rather than a breakdown point following months of erratic swings and unsuccessful upside continuation. Reversals can occur quickly in this type of area and do not require buildup.
Although SOL has aggressively corrected from its local highs from a structural perspective, the decline has been orderly rather than chaotic. As it descended into the rising weekly moving average, the price reduced volatility and lost momentum. This matters. Strong trends typically stall grind and ultimately decide rather than dying at support. Because it is in line with Solana's long-term weekly average, which has frequently withstood sell pressure in prior cycles, the $120 level is crucial.
The downside typically slows down significantly when SOL trades into this level. When the pressure subsides, buyers intervene sooner, sellers become hesitant and prices frequently plummet back. Because of this, quick reversals are typical here — not because sentiment suddenly shifts but rather because liquidity conditions shift. Momentum indicators corroborate this theory.
This allows SOL to climb higher without becoming exhausted right away. Additionally, volume has decreased into support, indicating that the move lower is weakening rather than picking up speed. If $120 holds, Solana can bounce back without a flawless setup.
As sidelined capital seeks confirmation that the worst is over, straightforward stabilization followed by a reclamation of short-term resistance could set off a dramatic bounce. Given how compressed price action has become, upside can happen quickly in that situation.
 Dan Burgin
 U.Today Editorial Team