
Disclaimer: The opinions expressed by our writers are their own and do not represent the views of U.Today. The financial and market information provided on U.Today is intended for informational purposes only. U.Today is not liable for any financial losses incurred while trading cryptocurrencies. Conduct your own research by contacting financial experts before making any investment decisions. We believe that all content is accurate as of the date of publication, but certain offers mentioned may no longer be available.
The market is trying to avoid entering a prolonged downtrend and is fighting back. With Bitcoin smashing through the 50 EMA, XRP is trying to recover but failing for now, and Ethereum hitting $4,200, with solid volume growth.
Bitcoin fights back
After a period of erratic trading and downward pressure, Bitcoin has successfully pushed back above a critical level, regaining $113,000. This move occurs as Bitcoin surpasses its 50-day EMA, a dynamic resistance that has frequently held back price action in September.
Although the breakout is a good technical development, it is still unclear if Bitcoin will be able to sustain these gains. Bitcoin’s continuous struggle in a midterm consolidation zone is highlighted by the daily chart. Buyers intervened to protect the 100-day EMA after the market had dropped to about $111,000 earlier this week, which led to a dramatic recovery.
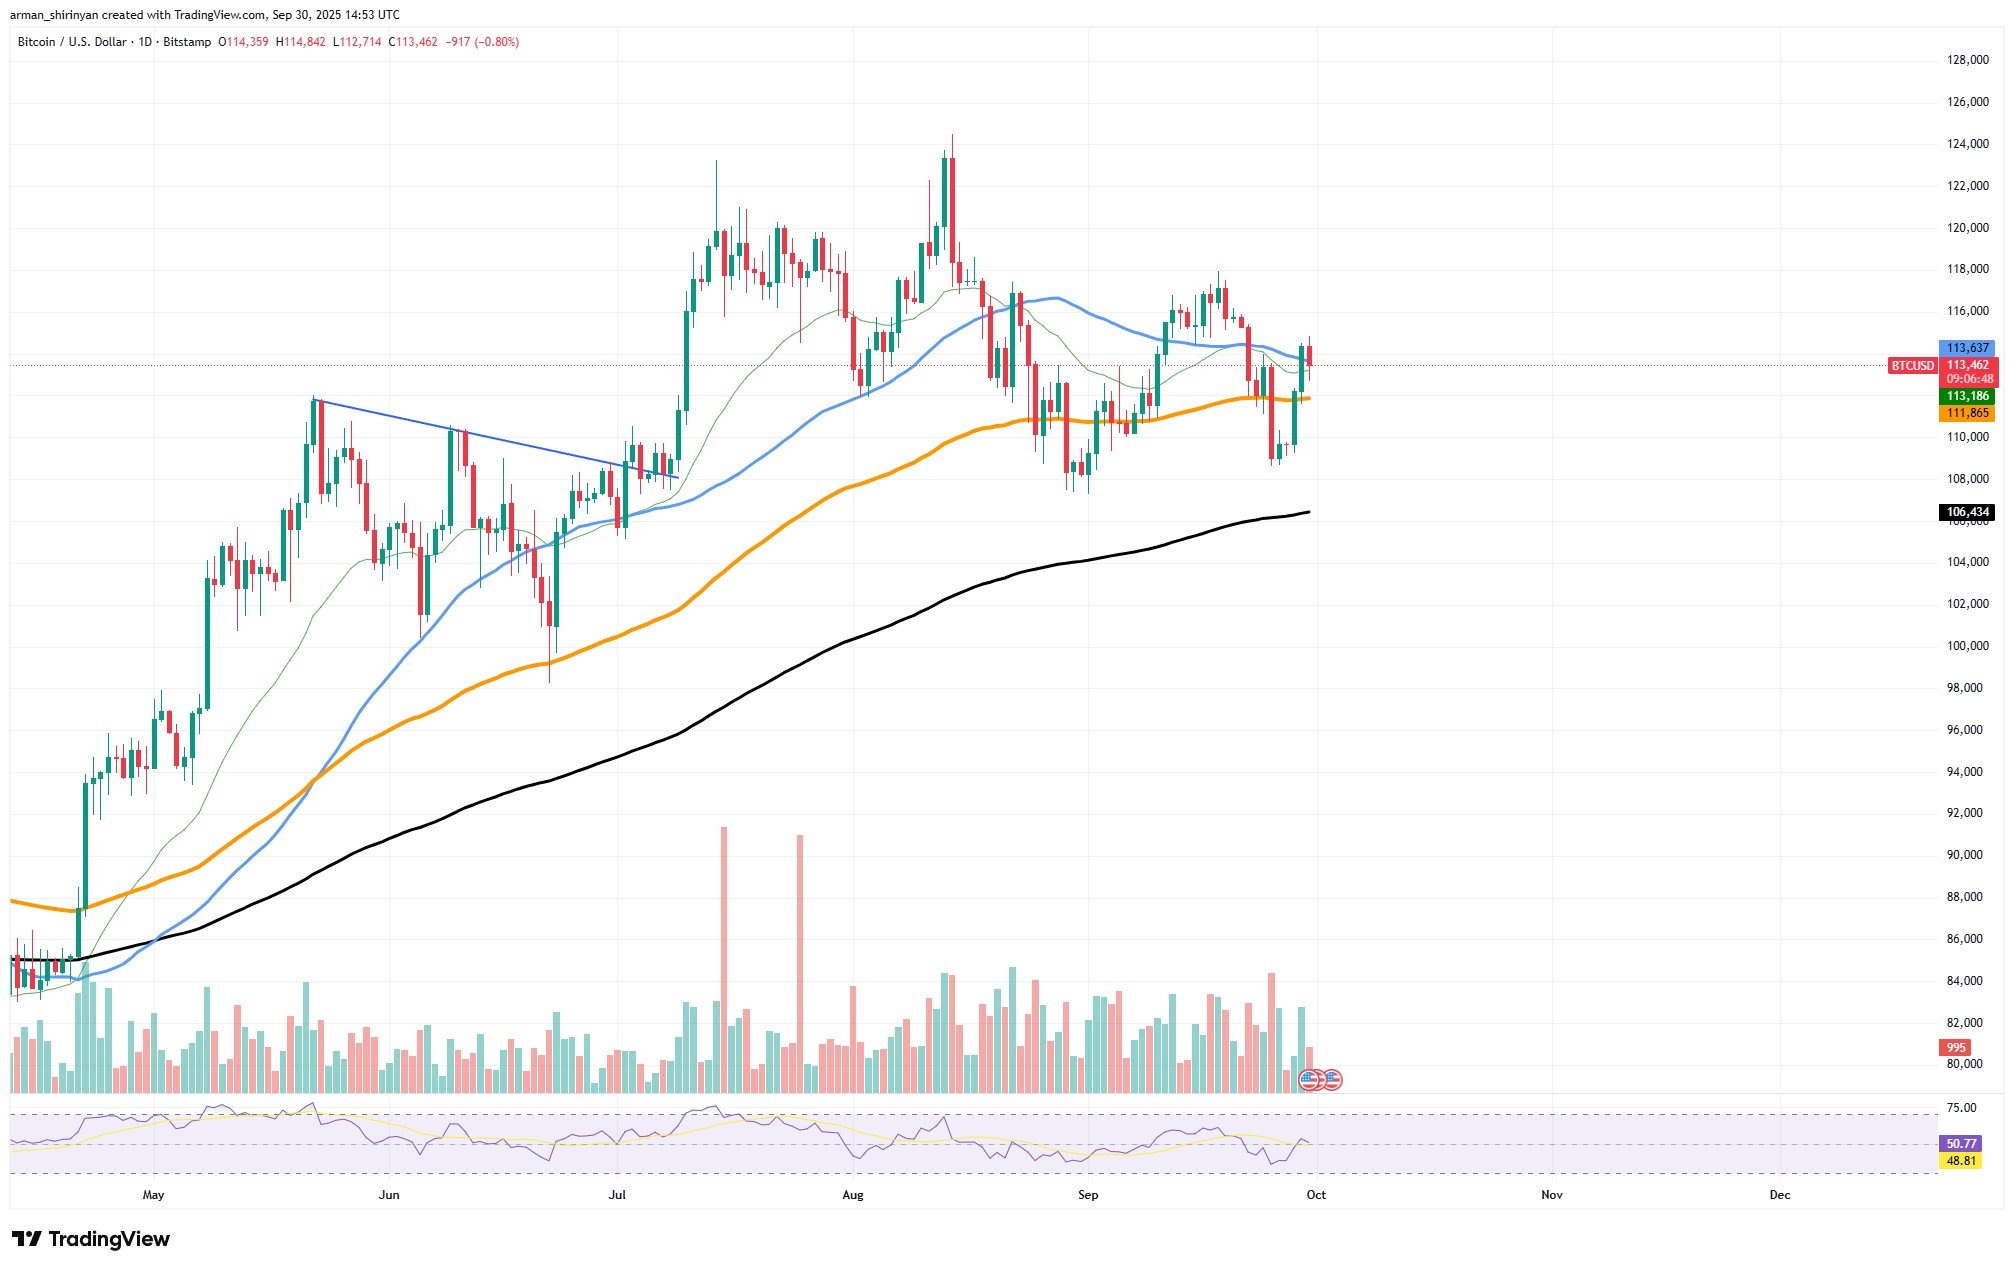
The 50 EMA’s successful recovery points to fresh bullish momentum, but the overhead supply is still high between $113,000 and $115,000, the starting point of earlier breakdowns. The rally has seen moderate volume, lacking the bursts of inflows typically seen during long-term breakouts. This makes it more likely that Bitcoin will be rejected at the current levels once more and fall back toward the $111,000-$112,000 range.
Bitcoin would need to clear the September swing highs around $118,000, in addition to maintaining above the 50 EMA, for a more robust bullish confirmation. This uncertainty is reflected in momentum indicators. The RSI, which is neutral and allows for movement in either direction, is at about 50.
Upward targets in the near term point toward $115,000 and $118,000, if bulls continue to exert pressure and consolidate above $113,000. On the downside, if the 50 EMA is not maintained, there may be a quick retest of the 100 EMA and, in a more severe correction, the 200 EMA close to $106,500.
Bulls now have the upper hand again, as Bitcoin has reclaimed a significant resistance zone at $113,000. However, the market may just as easily experience another retracement before attempting a more definitive breakout, given the low volume and resistance above.
XRP secures recovery
Although XRP has recovered from its September lows around $2.80, the recovery is already beginning to show signs of weakness. The token is having difficulty breaking through a significant technical barrier, the 26-day EMA, which is still acting as overhead resistance despite bulls’ optimism following the rebound. The recent upward push runs the risk of being little more than a brief relief rally if there is not a clear break above this level.
The issue is evident on the daily chart. XRP tried to rise higher after retesting the 100-day EMA as support, but the rally halted as soon as the price hit the 26 EMA. The short-term momentum is often determined by this moving average, and XRP’s failure to break through it indicates weakened buying pressure. Additionally, volume has been quiet during the recent rebound, not indicating that there was strong conviction behind the move.
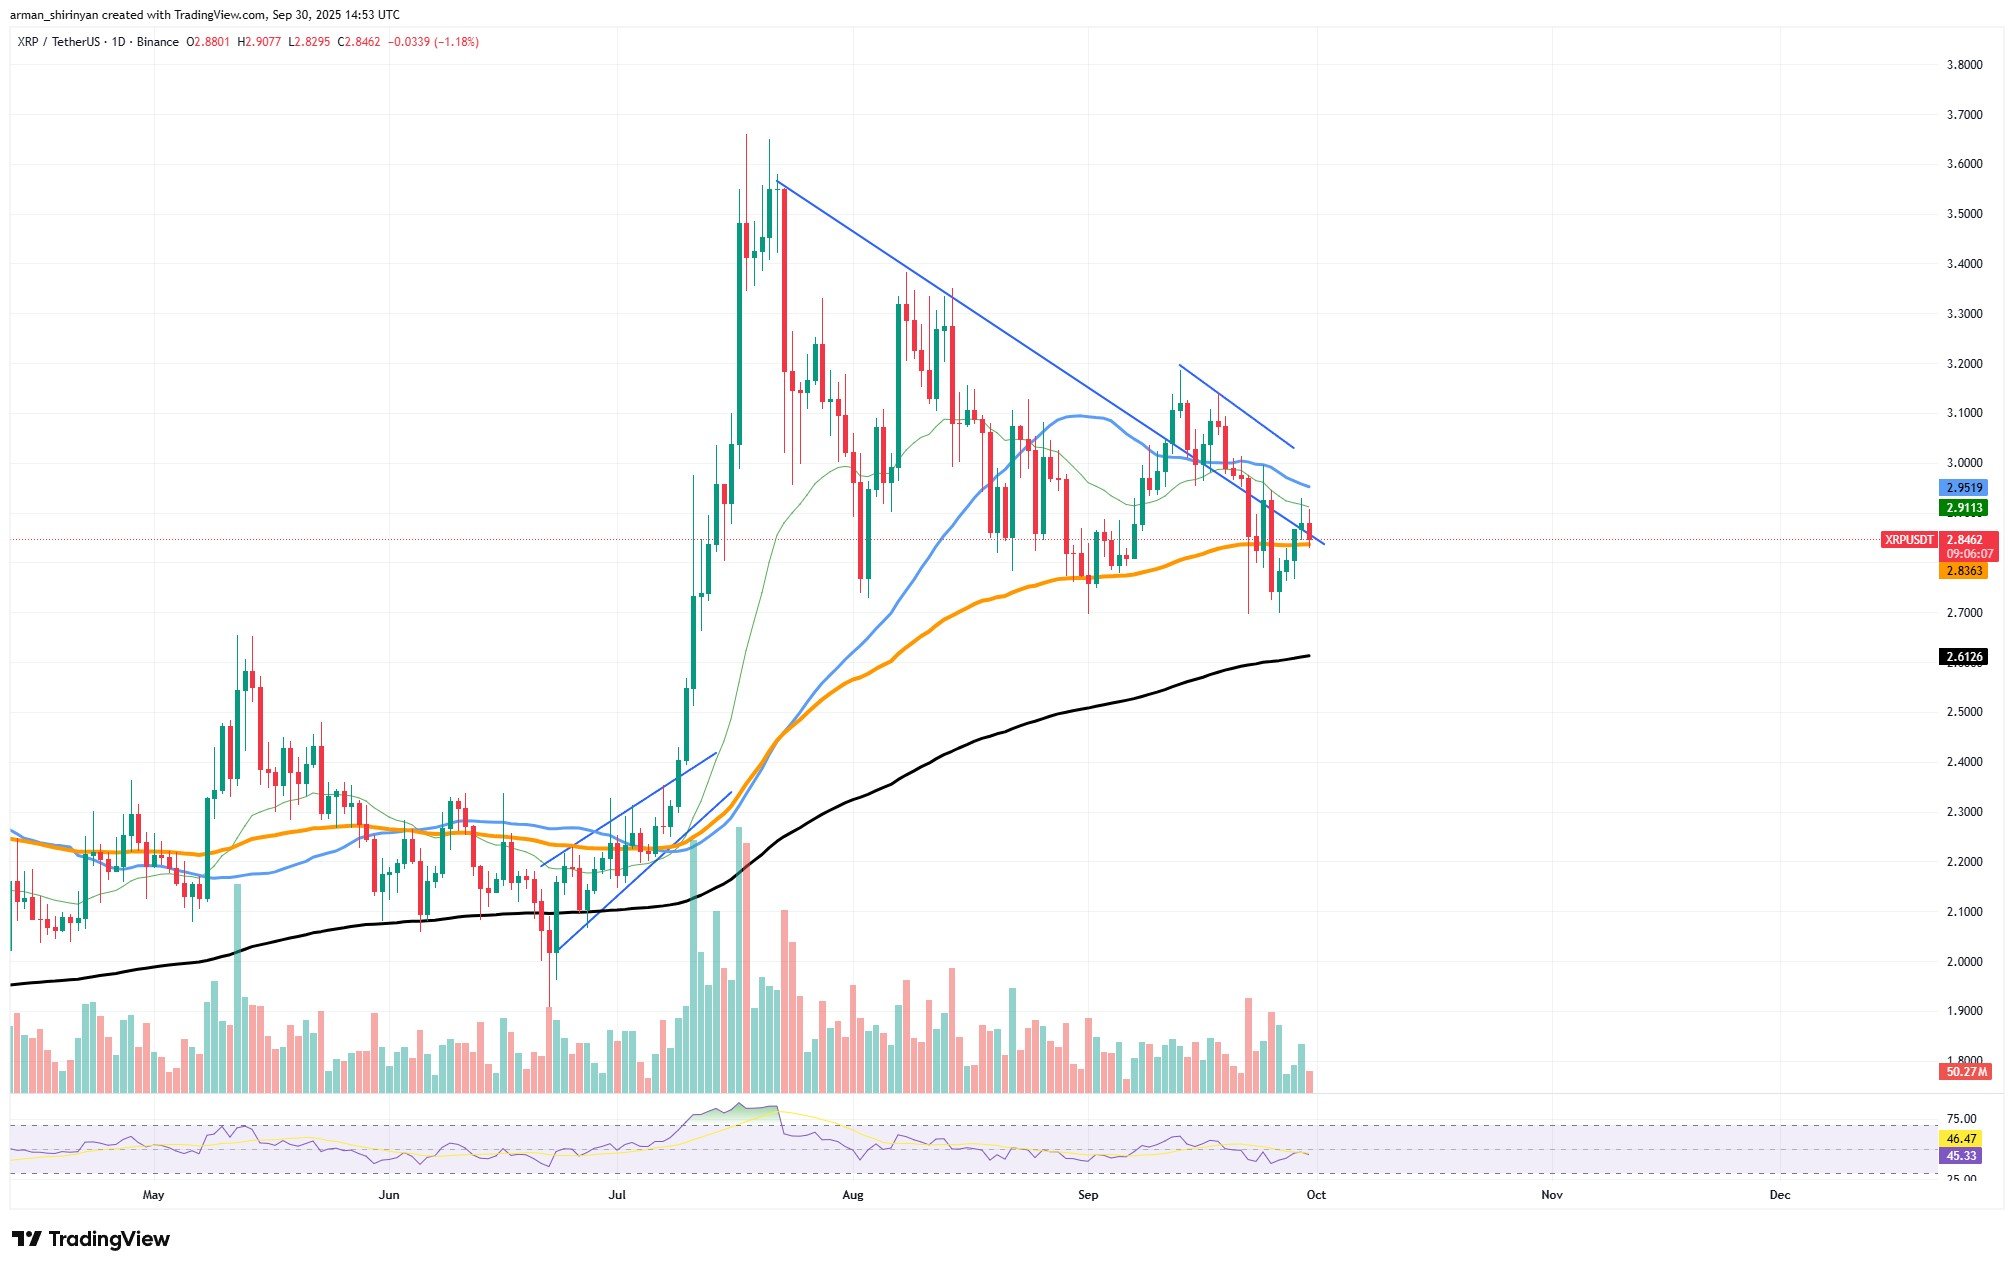
To make matters more cautious, the overall structure of XRP continues to show a downward trendline that has capped each rally since the middle of July. Upward targets like $3.00-$3.10 are still out of reach until bulls decisively break through the trendline and the 26 EMA. The 200-day EMA at $2.61, the next significant support zone, could be reached by XRP if it is unable to maintain above $2.80.
Momentum indicators range from neutral to marginally pessimistic. Since the RSI is at 46 and does not appear to be oversold, there is potential for additional declines if sellers take advantage of the situation.
Ethereum's attempt
Ethereum has recovered somewhat, returning to $4,200 following a decline to the $3,800 region last week. Bulls are somewhat reassured by the rebound, but the move’s momentum is not very strong. Technical indicators show that ETH might be running into significant resistance, which could prevent further gains.
The way that Ethereum interacts with the 26-day EMA is the most pressing problem. ETH tried to regain this short-term moving average following the recent rebound, but it was canceled at the 26 EMA, indicating a lack of short-term momentum. The market runs the risk of rolling over once more in the direction of deeper support zones unless ETH can maintain a firm close above this level.
Volume is another warning sign. Trading volume has been steadily declining despite the price recovery, indicating a thinning of participation. Usually, strong recoveries need growing volume to validate buyer conviction. The absence of volume expansion, in ETH’s case, suggests hesitancy and casts doubt on the viability of the current rally.
Ethereum is still capped on the daily chart by a descending triangle pattern made up of strong horizontal support and lower highs. Despite not fully collapsing, ETH’s inability to overcome the $4,400-$4,500 resistance cluster keeps bulls on edge. Because it is in neutral territory and does not exhibit any overbought or oversold signals, the RSI at 45 reflects this uncertainty.
To boost confidence in the near future, ETH needs to push volume higher and reclaim the 26 EMA. An additional retracement toward the 100-day EMA at $3,870, or in a bearish scenario even the 200-day EMA close to $3,620, could result from failing to do so.
Ethereum’s recovery to $4,200 is currently not a complete bullish reversal but rather a cautious one. ETH might be vulnerable in the upcoming sessions if there is not more buying interest and a clear break above resistance.
 Dan Burgin
 U.Today Editorial Team