
Disclaimer: The opinions expressed by our writers are their own and do not represent the views of U.Today. The financial and market information provided on U.Today is intended for informational purposes only. U.Today is not liable for any financial losses incurred while trading cryptocurrencies. Conduct your own research by contacting financial experts before making any investment decisions. We believe that all content is accurate as of the date of publication, but certain offers mentioned may no longer be available.
Bitcoin is heading into a technical setup that traders usually see as a red flag, but the same configuration led to a 46% surge the last time it appeared on TradingView charts. This turned what most people would call a bearish signal into one of the most profitable misreads of the year.
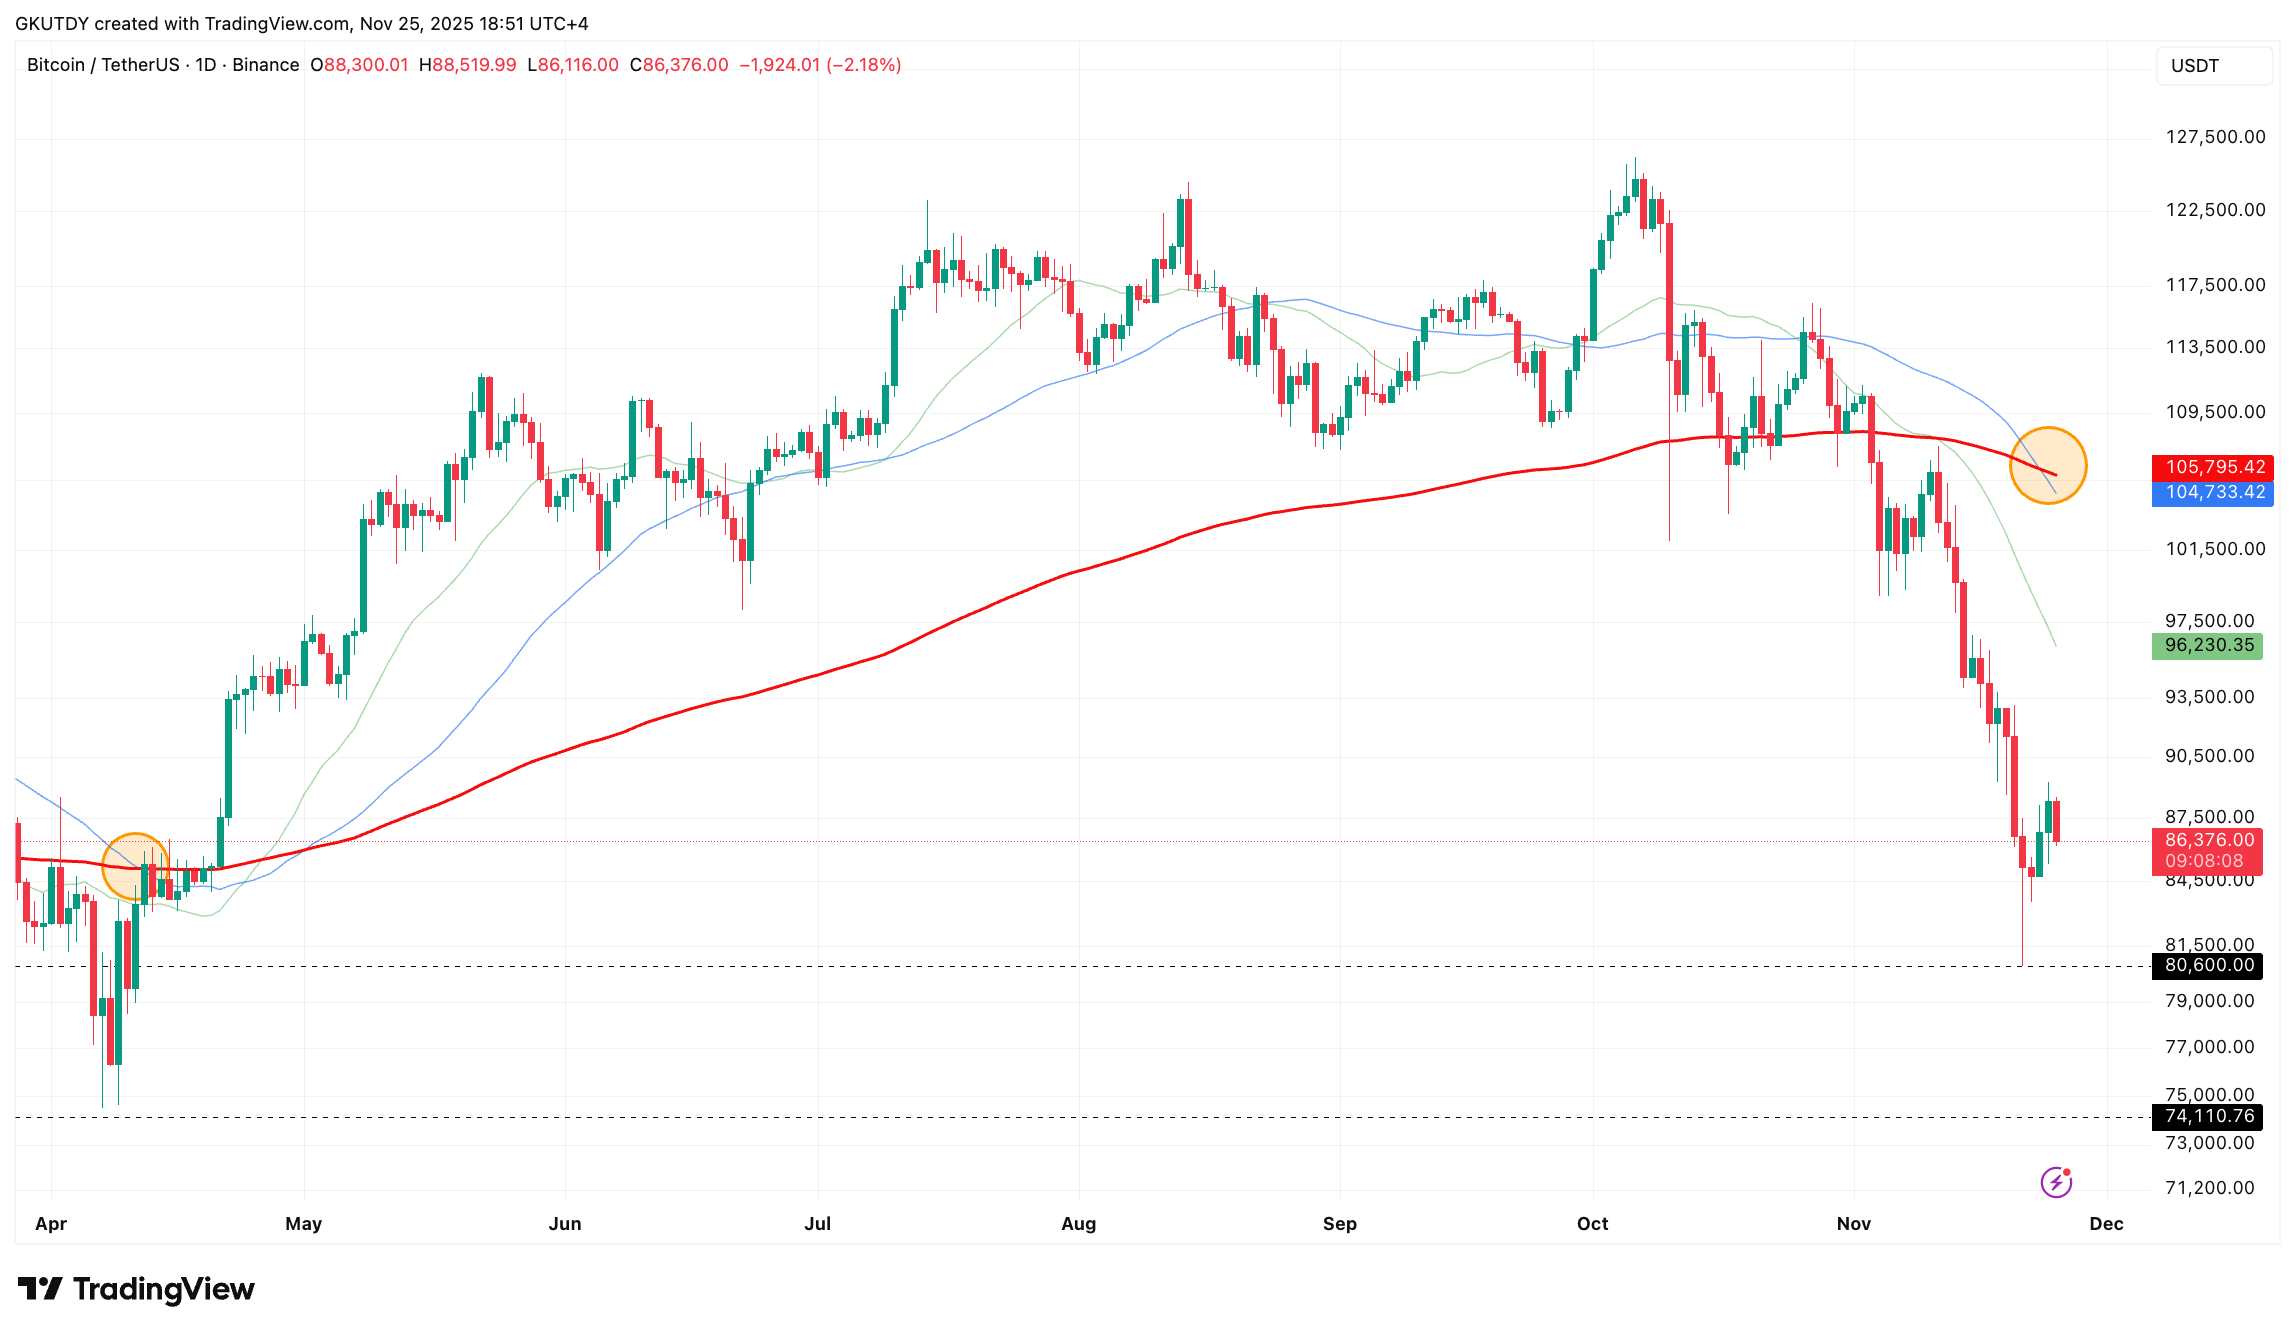
The 50-day moving average is now heading down toward the 200-day line, creating the classic death cross that is a familiar sight to anyone who has ever looked at a chart.
When these two lines meet, it usually leads to a lot of doom and gloom talk, but if you take a quick peek at the April setup on the chart, you will see that the price shot up right away after the cross was formed, moving from the mid-$60,000s to that long summer surge that reached up above $120,000 before the recent squeeze dragged Bitcoin back down to the high-$80,000 range.
The pattern matters because the market right now is treating every technical marker as if it is a new verdict on liquidity, ETF flows and macro risks. Yet this exact formation did the opposite of what it was supposed to do earlier this year.
Blessing in disguise
So now traders have to consider that the coming cross may end up as another fake bearish signal that clears the path for a rebound instead of another slide.
Right now, BTC is at around $87,000, which is still way below the 200-day line at about $105,800. But if this chart is anything to go by, it is showing that kind of stretched downside that we saw before the April reversal.

If the market reacts similarly again, the distance between the cross and the next major resistance cluster could turn into potential fuel instead of a ceiling. That would give buyers a pattern to work with instead of panicking.
 Dan Burgin
 U.Today Editorial Team