Over the previous weekend, when the quotes of the most top coins were moving up and down, the price of XRP stagnated, trading closer to its local minima. However, both traders and investors are not surprised by such a situation anymore.
While the trading volumes keep declining, businesses and top companies start using XRP coins for transnational payments. On the contrary, amid the positive background, negative news appears as well. The Monetary Authority of Singapore (MAS), which is known as the country’s operating central bank, is not going to implement Ripple’s technology in its service, as it does not see potential in it.
Now, let’s get into technical analysis to understand where XRP is about to move.

Unfortunately, our earlier price prediction failed, as the price could not reach $0.3050 and fix at this level.
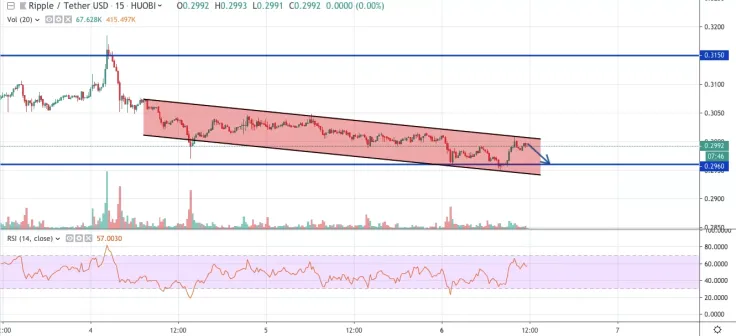
Looking at the 15-minute chart, one can notice that the quotes of XRP have been trading in the descending channel from the beginning of May. This is another distinctive feature of the coin, as the rates of Bitcoin and other top assets have shown a relative growth over the same period.
Moreover, the RSI indicator is located closer to the overbought zone, which means that the possible scenario is a decline to the $0.2960 level, serving as strong support.

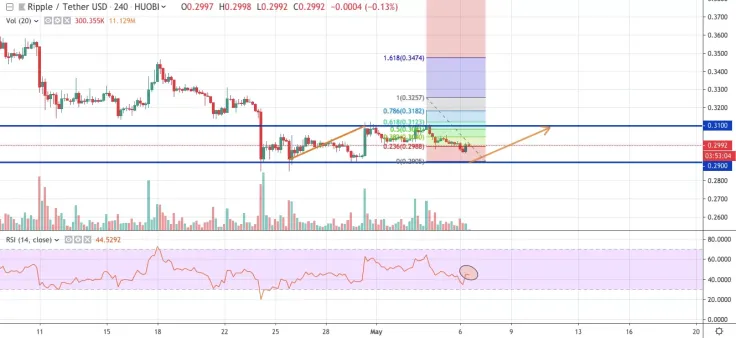
Analyzing XRP in the more extended range, the price is located between the support area at $0.29 and the resistance one at $0.31. The 4-hour chart looks more encouraging, as the RSI indicator is trying to get out from the oversold level, moving to the neutral zone. Positive tendencies are also backed by the Fibonacci retracement, which is currently in the orange area.
Overall, the resistance level at $0.31 can be reached until the middle of May.
The price of XRP is trading at $0.2993 at the time of writing.

 Vladislav Sopov
 Dan Burgin