
Disclaimer: The opinions expressed by our writers are their own and do not represent the views of U.Today. The financial and market information provided on U.Today is intended for informational purposes only. U.Today is not liable for any financial losses incurred while trading cryptocurrencies. Conduct your own research by contacting financial experts before making any investment decisions. We believe that all content is accurate as of the date of publication, but certain offers mentioned may no longer be available.
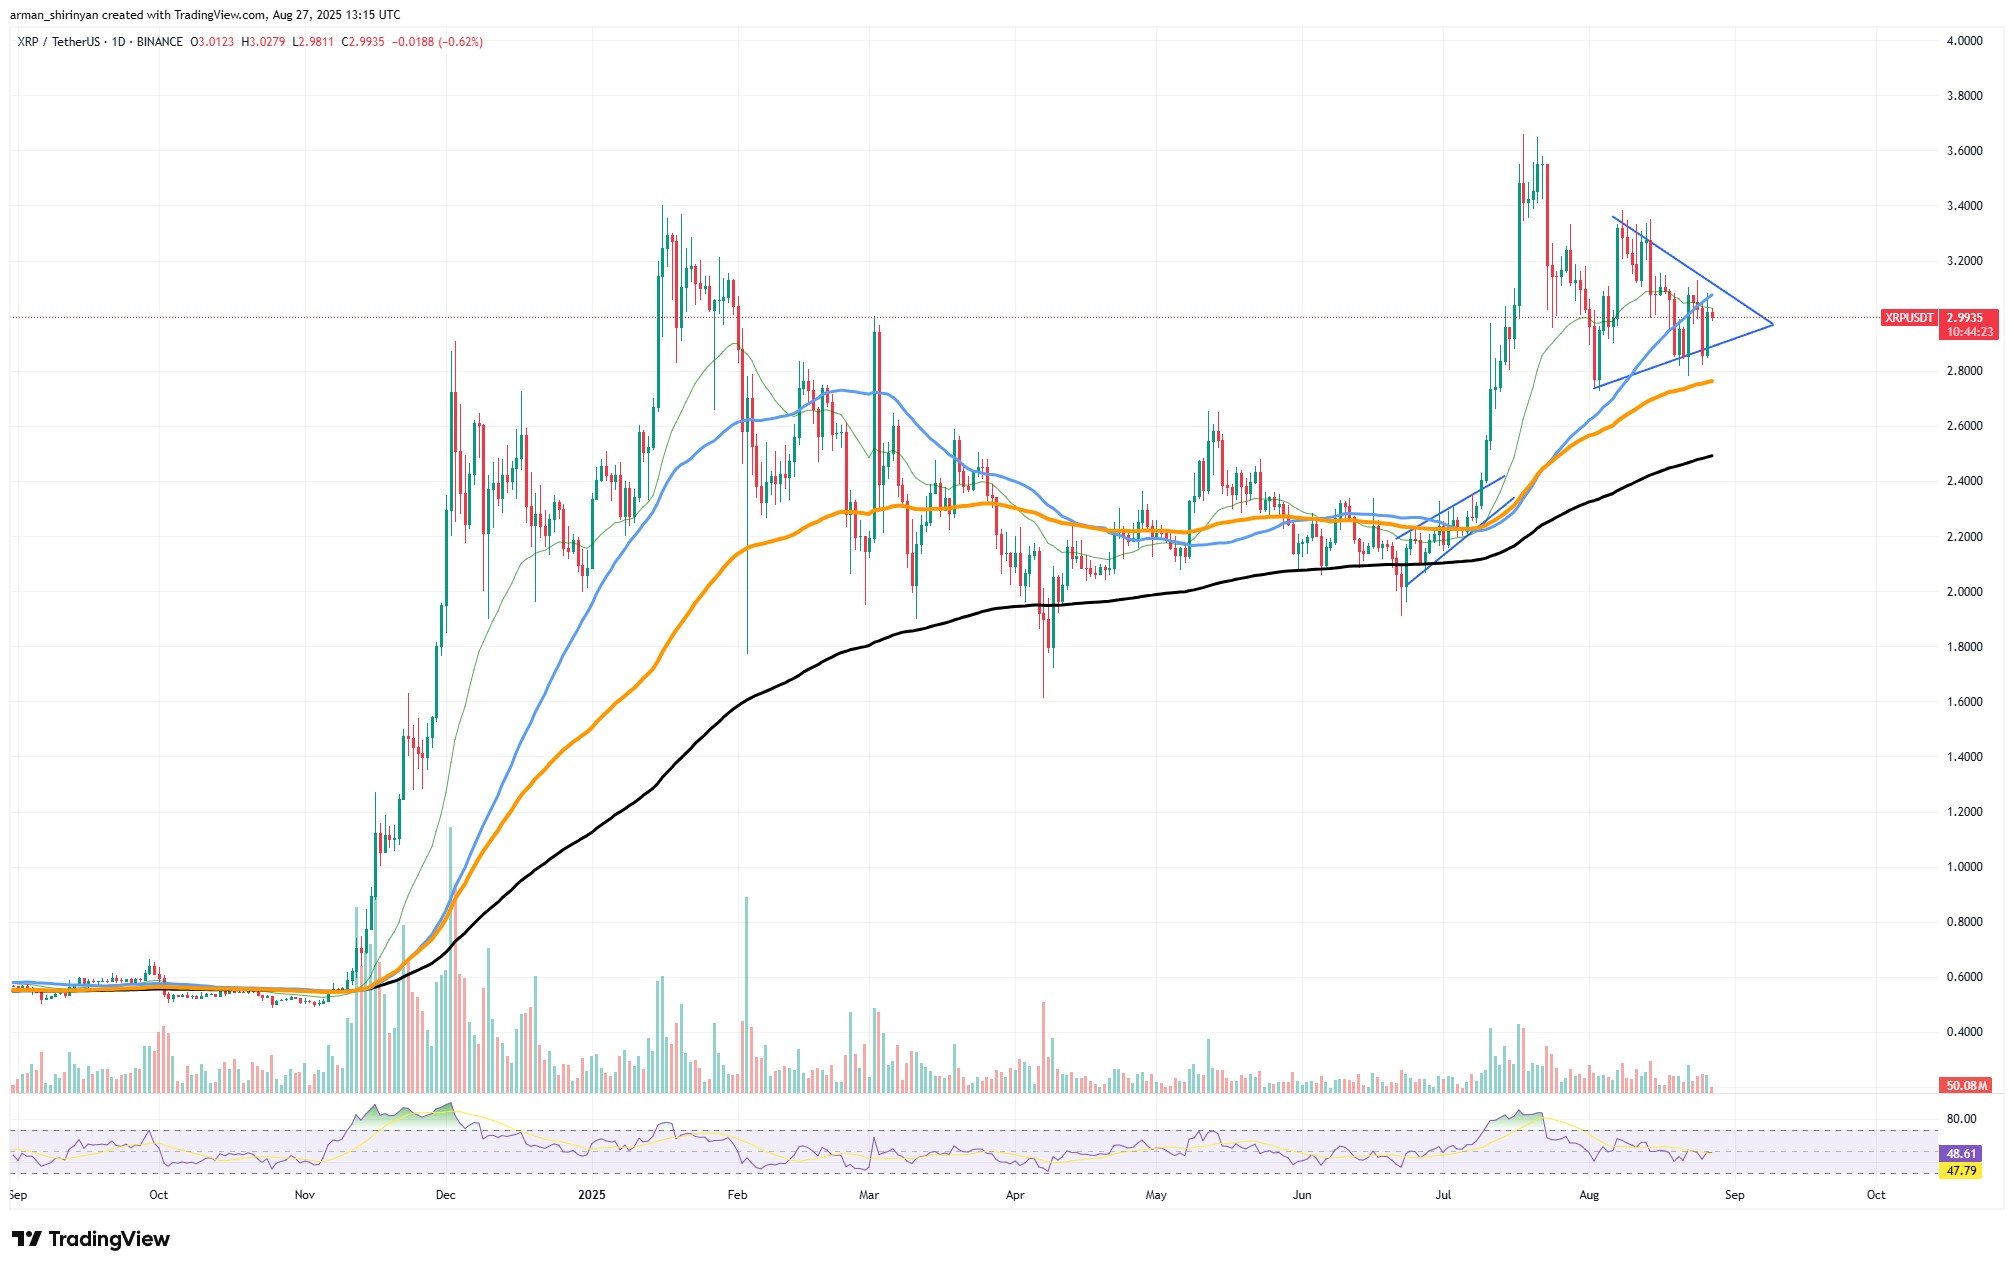
XRP's recent surge has been one of the cryptocurrency market's more promising periods, but the asset is currently at a crucial juncture, where momentum could start to wane. Following a significant upswing that saw the token rise above $3.50, XRP has since retreated into consolidation, and its current price centers on $3.00. The daily chart displays a symmetrical triangle pattern that indicates tightening conditions and an increasing likelihood of a breakdown.
The technical image draws attention to a delicate equilibrium. While the 200-day EMA at $2.49 provides deeper support, XRP is still holding above its 100-day EMA at $2.76. However, it is evident that buyers are losing steam when they consistently fail to push past $3.20. Despite showing indecision, the Relative Strength Index (RSI) is still neutral at 48, allowing for additional declines. Should the price close below $2.90, the structure might break down, leaving XRP vulnerable to losses that could negate a large portion of its recent gains.
Trends in volume increase caution. Since the July rally, trading activity has significantly slowed, and the absence of significant inflows points to waning interest. Sentiment could move from consolidation to correction if the symmetrical triangle breaks to the downside in the absence of fresh buying pressure.
The larger story of XRP's recovery has not entirely vanished, though. Even though a reversal is still possible, XRP is still far above its spring levels, and the fact that it has regained the 200-day EMA for the first time in years shows that it is resilient over the long run. But when buyers are unable to maintain higher highs, momentum-driven rallies often stall, and XRP's current configuration appears to be one of those times.
Bitcoin gets pushed
The market's path into September may be determined by the technical level that Bitcoin is testing once more. Bitcoin is currently trading at about $111,000, perilously perched on its 100-day EMA after peaking at about $126,000 earlier this summer. In the past, this moving average has served as both powerful resistance and support, but the graph indicates that its defense may be nearing the end. Sellers are in control as Bitcoin repeatedly fails to regain the $115,000-$116,000 range, according to the daily candles.

There is not much margin for error in the current test of the 100-day EMA, and the breakdown through the 50-day EMA already indicated waning momentum. If Bitcoin is unable to maintain this level, the next logical support is located at the 200-day EMA, which is close to $103,800 and perilously near the psychologically significant $100,000 mark. Because $100,000 lacks the structural support found in previous consolidation zones, this level is especially worrisome.
It is thinly backed instead, which means that if it breaks, stop-loss orders and leveraged long liquidations could cause the market to move rapidly lower. Before buyers intervene, Bitcoin might swiftly find itself in the mid-90,000s in such a situation. The Relative Strength Index (RSI) reflects this weakening trend, currently hovering around 41, its lowest since spring. Recent bounces have also seen a drop in volume, indicating that buyers are not acting decisively. The bearish momentum is likely to continue in the absence of fresh demand.
A strong rebound above $115,000, on the other hand, would reverse much of this bearish setup and reopen the way to retesting $120,000+. However, the bulls now have the burden of proof. To sum up, Bitcoin is at a critical juncture. When the 100-day EMA is lost, the market begins to decline toward the 200-day EMA, where $100,000 is the last line of protection. A much more severe correction than most people expect could be in store for the market if that support breaks.
Ethereum does not forget $5,000
After several spectacular rallies, Ethereum is still one of the best-performing stocks in the current market cycle, trading close to $4,600. ETH has avoided the kind of steep declines observed in Bitcoin and Solana, in contrast to many other significant cryptocurrencies that have experienced more severe corrections in recent weeks. With $5,000 firmly in sight, Ethereum's resilience makes it a strong contender to reach a new all-time high.
ETH is riding its 20-day EMA as dynamic support on the daily chart, with higher lows continuously forming since July. With only minor retracements, the asset has been consolidating at higher levels since breaking above key resistance at $4,200.

On the bullish side, momentum indicators are also in favor. At present, the RSI is close to 61, indicating sound strength without being overextended, allowing for further upward movement. According to the structure, ETH is poised for a further upward leg, and a breakout above $4,800 could easily drive the price up to $5,000 and higher.
Ethereum's relative strength stems in part from the fact that despite an increase in market volatility, it has escaped significant corrections. ETH has remained under constant upward pressure, while altcoins like Solana and Dogecoin displayed weakness and Bitcoin faltered at significant resistance.
 Dan Burgin
 U.Today Editorial Team