
Disclaimer: The opinions expressed by our writers are their own and do not represent the views of U.Today. The financial and market information provided on U.Today is intended for informational purposes only. U.Today is not liable for any financial losses incurred while trading cryptocurrencies. Conduct your own research by contacting financial experts before making any investment decisions. We believe that all content is accurate as of the date of publication, but certain offers mentioned may no longer be available.
Although panic-selling is finally slowing down, with Bitcoin's decline, the market is still at risk. The most recent BTC liquidation heatmap gives a very clear indication of where this crash is most likely to stop, and it naturally fits the chart's technical structure almost exactly. According to CoinGlass's one-year BTC liquidation heatmap, there is a very bright liquidity cluster centered on $83,000. In case the cluster gets broken, the next support levels to activate will be $78,000 and $75,000, approximately.
Potential support range
It is not a random number. The areas with the highest concentrations of leveraged positions — levels where the market is motivated to pursue stops, compel liquidations and eliminate excessive leverage — are shown on liquidation maps. For months, liquidity has been discreetly stored in the $83,000-$84,000 range.
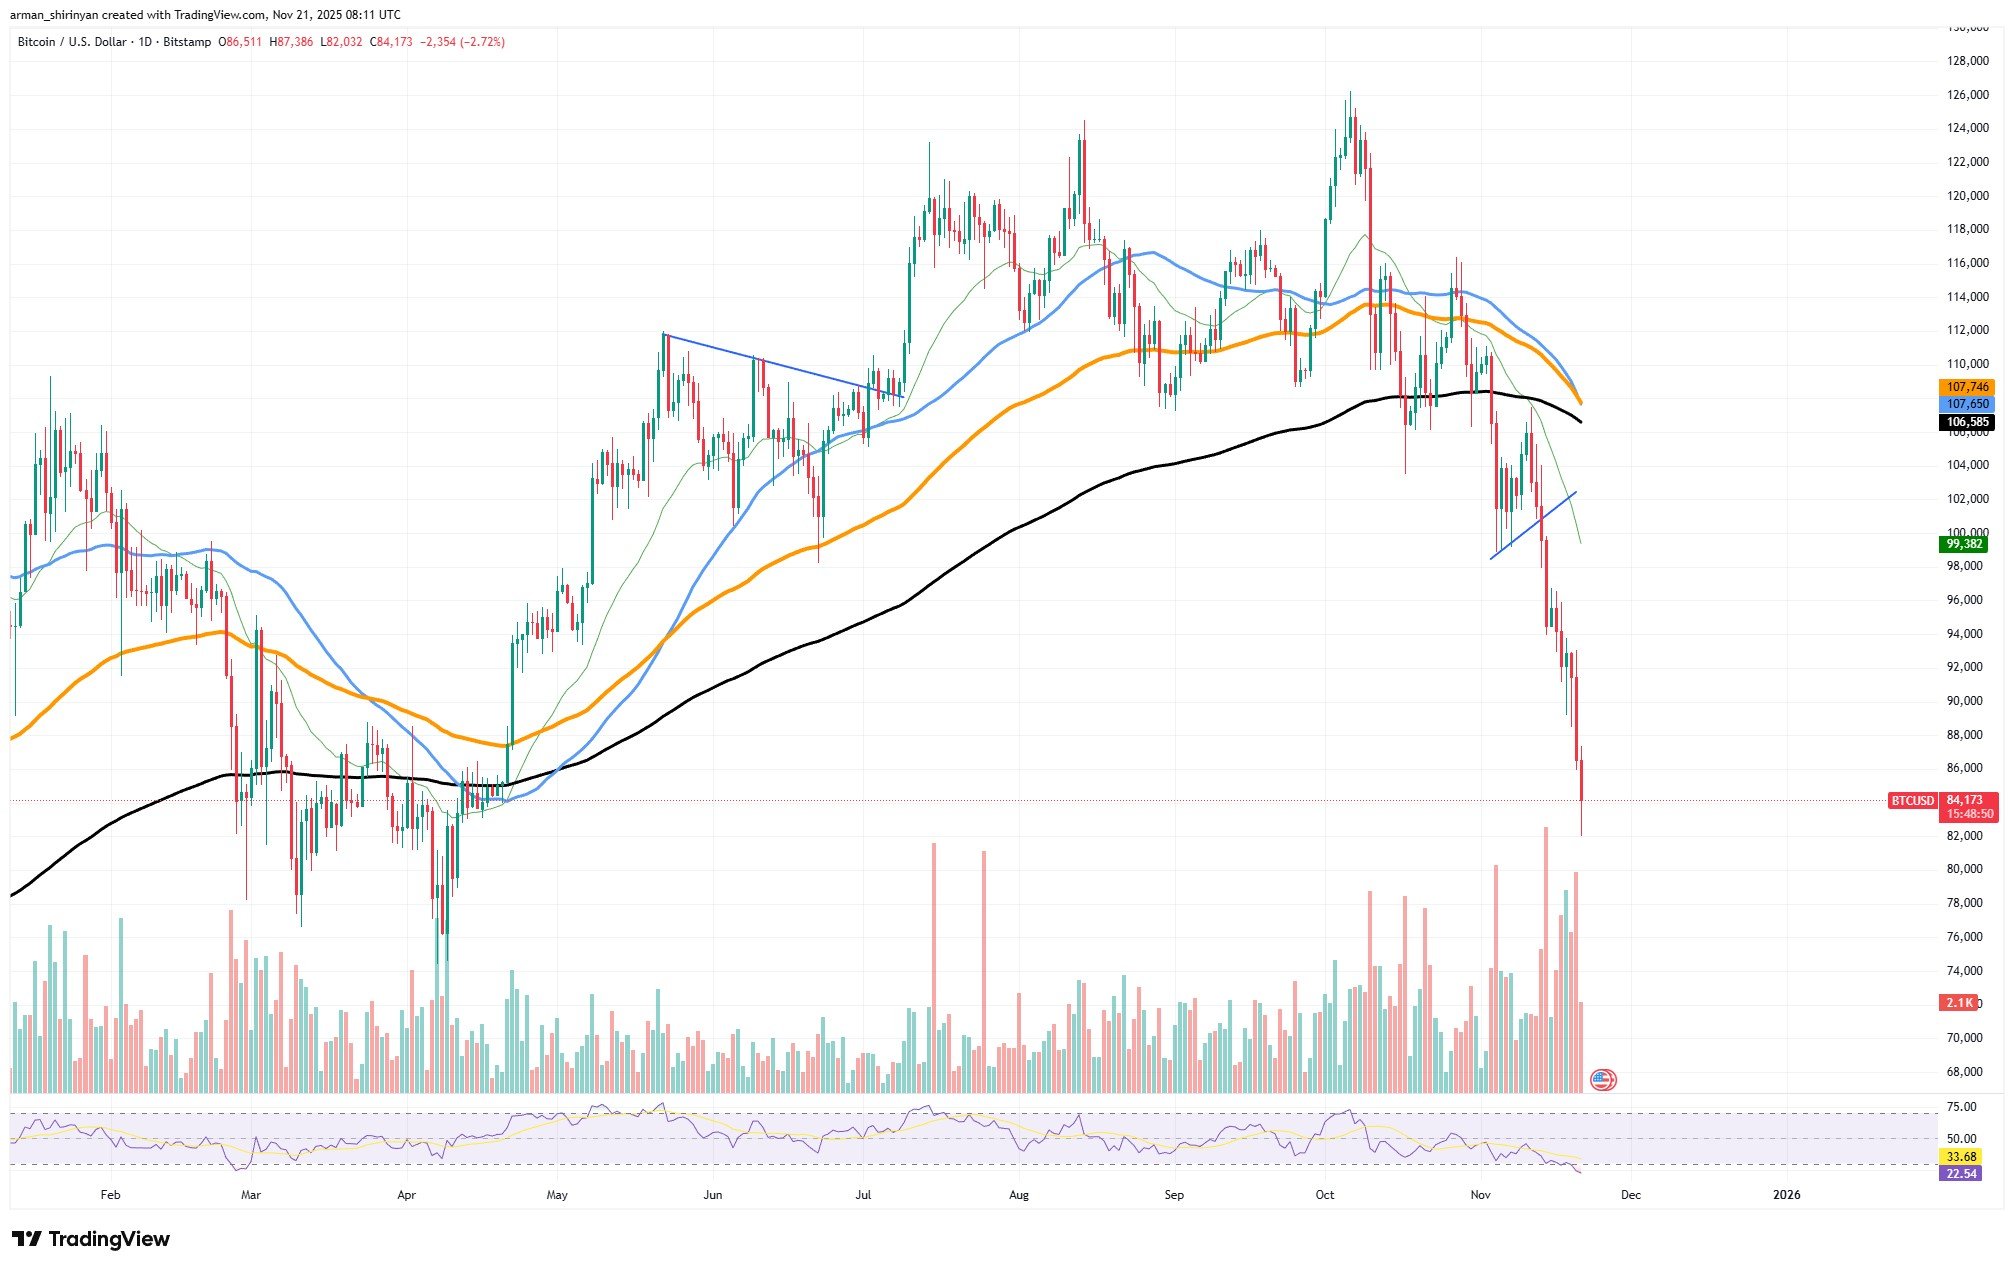
The market is drawn to that cluster like a magnet now that Bitcoin has broken below $90,000 with no resistance on the way down. This image is only supported by the chart. After losing the mid-$90,000 zone and cutting through short-term EMAs without pausing, the breakdown quickened. Heavy forced selling, liquidations, capitulation moves and margin calls were confirmed by the spike in volume.
Candles are further from the moving averages than they have been since the early-cycle correction in mid-2024, and the RSI has fallen into deep oversold territory. Rarely does this type of deviation last for very long. Even in severe downtrends, markets do not move in straight lines, and Bitcoin might see a recovery at around $78,000 if the liquidity cluster disappears.
No hard support levels
Before $83,000, there is hardly any significant support, and the same technical image reveals a void below the current price. The market previously found aggressive accumulation at this point, which is also the final significant pivot from the previous consolidation range. It becomes the perfect setting for a short-term reversal or, at the very least, a bounce powerful enough to reset indicators and slow the bleeding if Bitcoin tags that area while mass liquidations explode. This does not imply that $83,000 will hold.

The market moves into a deeper corrective phase, with $76,000-$78,000 as the next target if that level is unsuccessful. However, from the standpoint of both classical chart structure and liquidity, $83,000 is currently the most sensible stopping point. This area will be closely watched by buyers who have been anticipating a capitulation-style discount.
 Dan Burgin
 U.Today Editorial Team