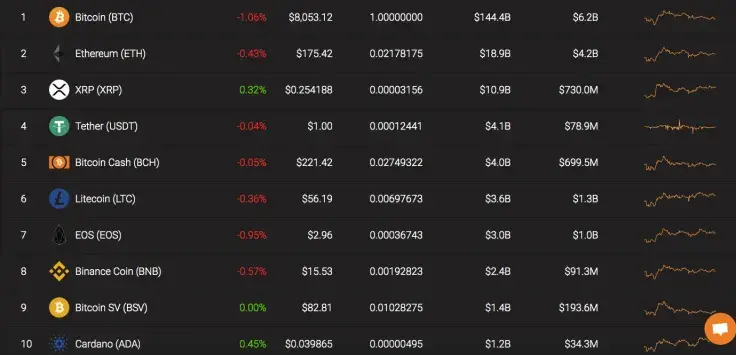
The cryptocurrency market has not shown significant changes over the weekend, the rates of the top coins have almost unchanged. However, the total market capitalization has declined and now makes up $216 Bln.

Ethereum is showing a relatively more confident dynamics, with a favorable external background; it can be considered as one of the main coins in the portfolio amid a shortage of trading ideas in other assets.
|
Name Leaked Email to Epstein Framed XRP Supporters as Enemy, Ex-Ripple CTO Says
Ripple CTO Emeritus Breaks Silence on XRP and XLM in Epstein Files
Crypto Market Review: Did XRP Downtrend End? Shiba Inu (SHIB) Taking a Beating, Bitcoin (BTC) Safe Above $80,000
U.Today Crypto Digest: XRP Millionaires Awaken, Shiba Inu Buyers Step In, Dogecoin Sees 10,782% Rise in Futures Volume
|
Ticker Advertisement
|
Market Cap |
Price |
Volume (24h) Advertisement
|
Change (24h) |
|
Ethereum |
ETH |
$19 041 254 651 |
$176,26 |
$5 986 339 065 |
-0,43% |
ETH/USD: Charts are Pointing at a Further Decline
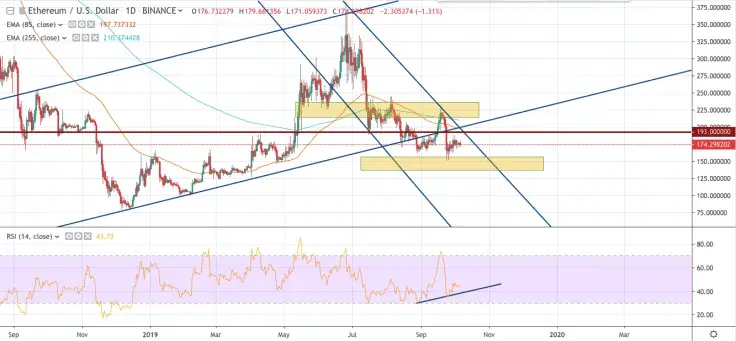
ETH/USD quotes remain below the resistance level. Moreover, the price pushed off from moving averages, indicating downward momentum.

As a medium-term trading idea, one should expect a test of the broken border of the upward channel at the level of $193, then a continued decline and a test of the support area at $140. The values of the RSI indicator also support the ongoing decline. There is an assumption that the “Head and Shoulders” pattern is being formed on the indicator, in this case, a downward trend is about to be continued.

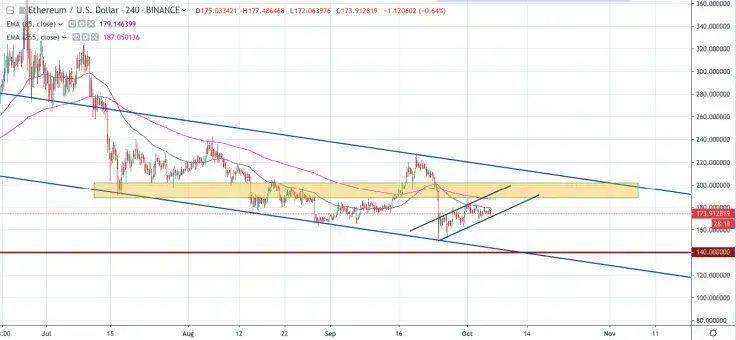
On the 4H chart, the leading altcoin is moving within the descending channel. A downward model “Flag” is being formed, which indicates a potential continuation of the fall with the first target at $140. Confirmation of the decline will be a breakdown of the lower border of the “Flag” model with fixing quotes below the level of $150.
Ethereum is trading at $173,82 at press time.

 Arman Shirinyan
 Gamza Khanzadaev
 Tomiwabold Olajide
 Alex Dovbnya