
Disclaimer: The opinions expressed by our writers are their own and do not represent the views of U.Today. The financial and market information provided on U.Today is intended for informational purposes only. U.Today is not liable for any financial losses incurred while trading cryptocurrencies. Conduct your own research by contacting financial experts before making any investment decisions. We believe that all content is accurate as of the date of publication, but certain offers mentioned may no longer be available.
The market's pacing is not turning bullish at this point in time. XRP will see a death cross next week if the bearish pace persists on the market, while Ethereum and Cardano are slowly losing hope out there.
XRP's bearish crossover
A death cross, which is a technical event where the 50-day moving average crosses below the 200-day moving average and usually indicates a shift toward long-term bearish momentum, is dangerously close to forming on XRP. This crossover could happen in a week if the current price action persists, which could solidify XRP’s downward trend and lead to another round of sell pressure.
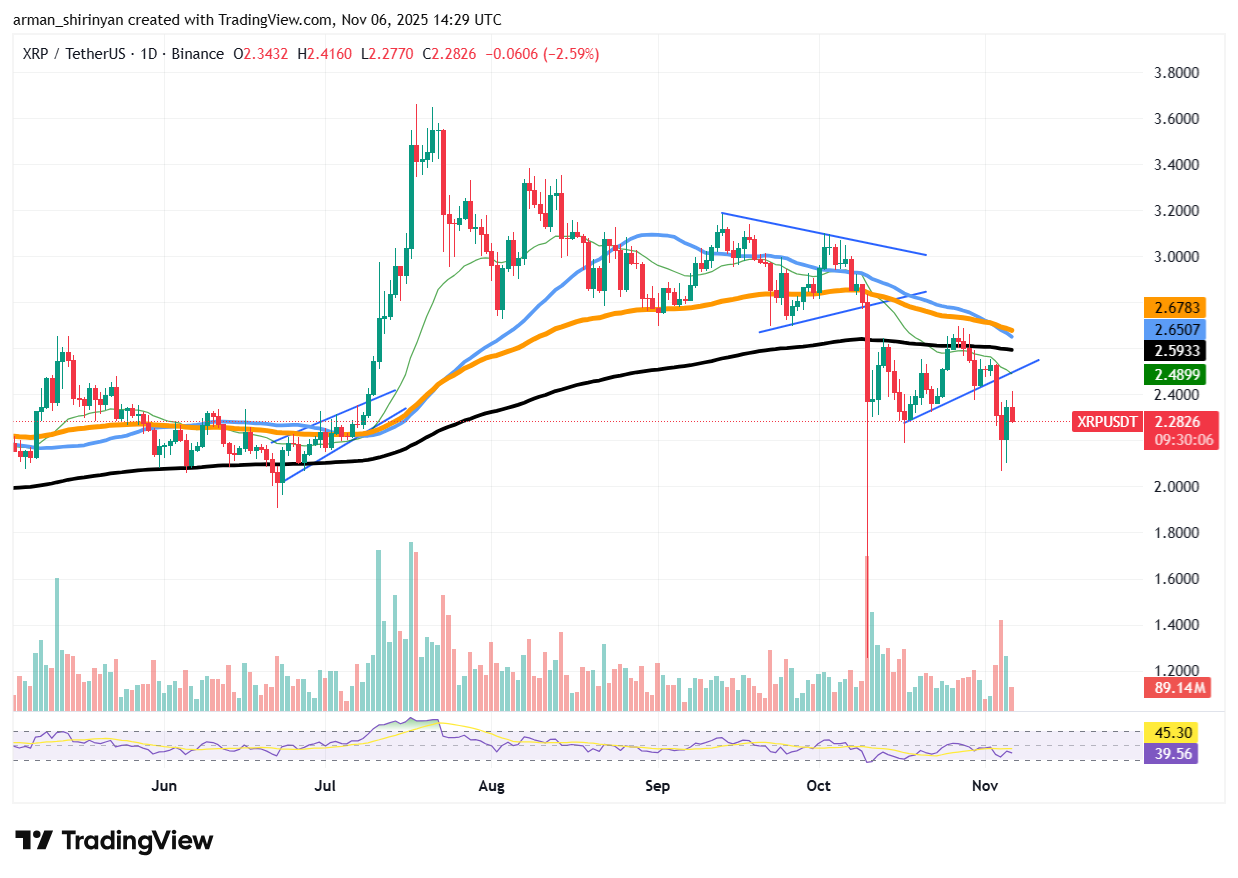
After failing to maintain any significant recovery above $2.50, the token is currently trading at about $2.29, down about 2% over the past day. The larger bearish structure that has been forming since August is reinforced by the chart’s steady pattern of lower highs and lower lows.
Strong resistance, which buyers have repeatedly failed to break through, is confirmed by the rejection close to the $2.60-$2.70 zone, which is also where the major moving averages cluster. The growing pressure from whales to sell is contributing to the bearish setup.

As previously reported, a recently funded wallet opened a huge 20x leveraged short against XRP and added $7 million in USDC to Hyperliquid. This stance raises the possibility that institutional traders are expecting a more significant correction, as does the presence of other sizable bearish bets on derivatives platforms.
Indicators of momentum are also becoming negative. While trading volume is still increasing on red candles, a classic indicator of distribution, the RSI, has fallen below 45, indicating waning buyer conviction. A drop toward $1.85 or even $1.60 cannot be ruled out if the death cross is confirmed.
XRP could easily retest its next important support near $2.00; if it breaks, any short-term recovery is probably going to encounter significant obstacles unless the overall market stabilizes. As of right now, the chart and order flow both suggest that XRP’s uptrend is precarious and that the approaching death cross could be a catalyst for its eventual collapse.
Ethereum's last chance?
Ethereum is currently at what may be its last line of defense before a major collapse in the direction of the $2,000 area. The cryptocurrency has firmly lost its 200-day moving average, which had acted as long-term dynamic support since February. It is currently trading close to $3,600, down about 1.7% over the previous day.
Due to this breakdown, market sentiment has become extremely pessimistic, placing ETH in a position where any additional weakness could lead to deeper losses and cascading liquidations. According to the chart structure, Ethereum’s price has been trending downward since July, with lower highs continuously rejecting from the $4,000-$4,200 range.

Technically, trend exhaustion has been confirmed by the recent decline below the black 200-day EMA. The next strong accumulation zone typically forms around $2,000-$2,200, where substantial buying activity previously reentered the market in early 2024, once ETH closes significantly below this moving average.
Momentum indicators are not indicating a reversal, which adds to the pressure. Although volume data does not yet point to a significant buying reaction, the RSI has fallen below 35, indicating oversold conditions. Short-term traders seem reluctant to intervene until a more distinct support floor is created, and sellers continue to hold a dominant position.
Positively, this $3,500-$3,600 range still corresponds to a crucial structural level that served as resistance several times prior to ETH’s midyear surge. A short-term recovery toward $4,000 is conceivable if bulls are able to hold this level and move ETH back above $3,800.
The psychological $2,000 mark would then be the next — and possibly last — significant buying ground before long-term holders begin to give up, but failing to hold here would probably open the floodgates to $3,000.
Cardano not recovering
As the asset moves into territory that would be deemed intolerable for any continuing bull market, Cardano is displaying grave warning signs. ADA is currently trading at about $0.53. Over the past 24 hours, it has dropped more than 2%, continuing an unrelenting downward trend that has caused its RSI (Relative Strength Index) to reach 31, a level usually associated with extremely oversold conditions.

The deterioration of ADA’s entire technical structure is especially worrisome. The 20-day, 50-day, 100-day and 200-day EMAs are all stacked in descending order on the chart, which shows a complete death cross alignment across major exponential moving averages. This arrangement indicates a deep-seated loss of momentum over all time periods, not just temporary weakness. In the past, these arrangements have typically preceded extended periods of stagnation or further price capitulation.
After ADA lost its support around $0.65, which was in line with its 200-day EMA, the decline quickened. Throughout 2024, that level had functioned as a long-term pivot, consistently drawing interest from buyers. Strong resistance resulted from its decisive breakdown in late October, and every subsequent attempt at recovery has been quickly dismissed.
The bearish case is supported by volume analysis, which shows that sellers are still in control due to weak buying inflows and increasing sell-side pressure. A decline toward $0.45 or even $0.40 seems more likely unless ADA swiftly reclaims the $0.60-$0.65 range. Although a brief technical rebound is possible given the oversold situation, it is unlikely to last long in the absence of fundamental or market-wide catalysts.
 Dan Burgin
 U.Today Editorial Team