
Disclaimer: The opinions expressed by our writers are their own and do not represent the views of U.Today. The financial and market information provided on U.Today is intended for informational purposes only. U.Today is not liable for any financial losses incurred while trading cryptocurrencies. Conduct your own research by contacting financial experts before making any investment decisions. We believe that all content is accurate as of the date of publication, but certain offers mentioned may no longer be available.
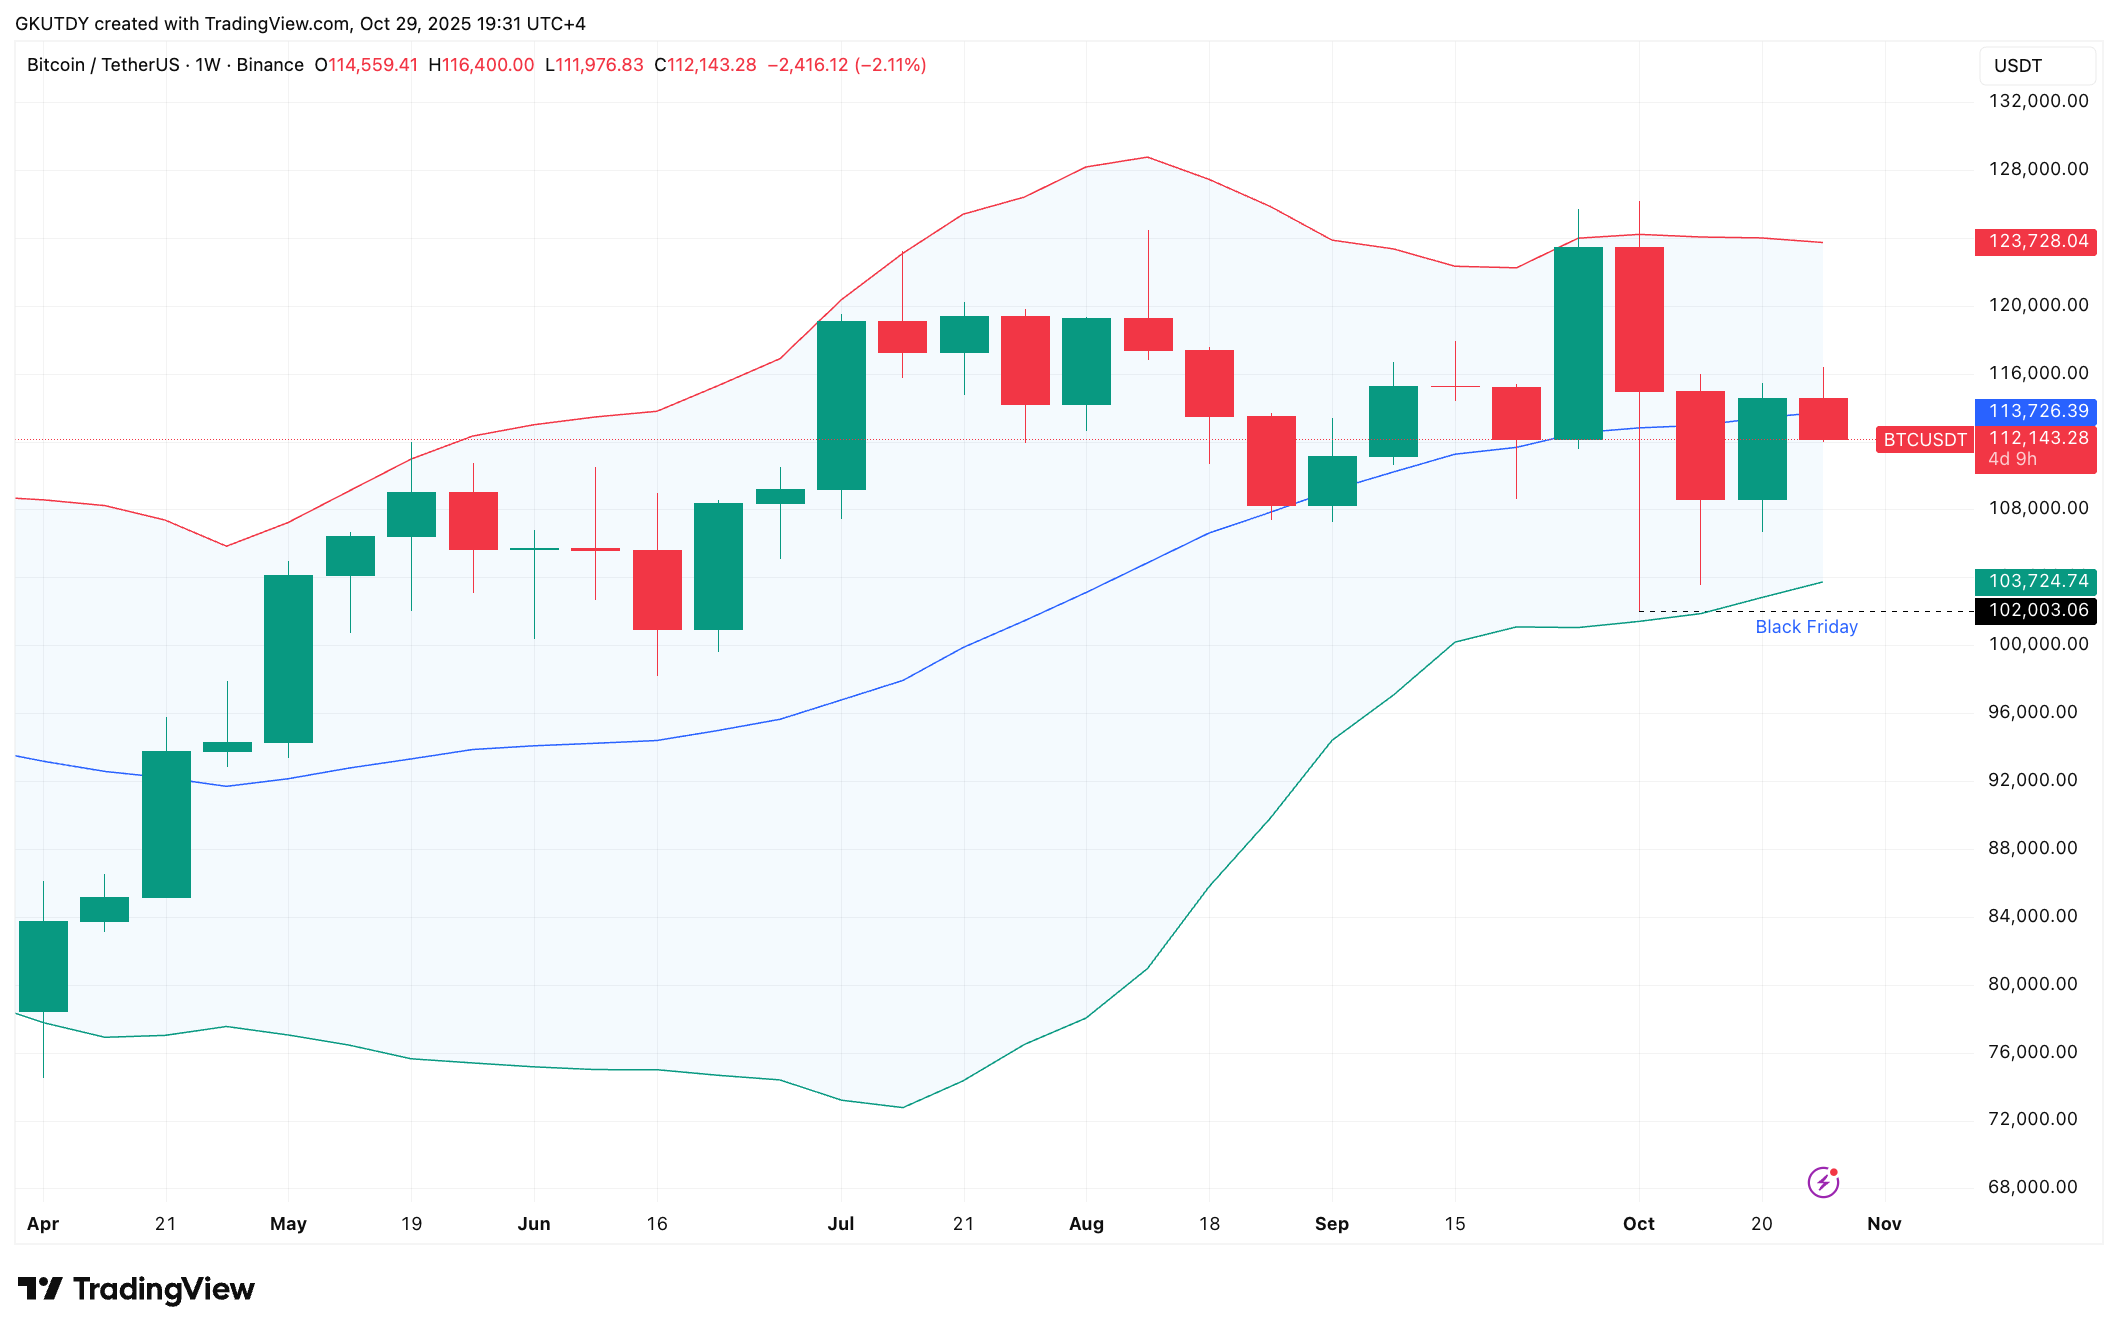
What happens with the Bitcoin (BTC) price right now is a question that bothers probably everyone on the crypto market, and from the perspective of the Bollinger Bands, the answer to this is grim. Now trading at $112,498, which is below the weekly Bollinger midband at $113,744, Bitcoin is under the dividing line for trend direction.
When the price closes below the middle band, the focus shifts to the lower band — at $103,752 currently and close to the October low that was set during the brutal "Black Friday" collapse on Oct. 11.
That October low was rapid but short-lived. However, the fact that the lower band now lines up with the same zone suggests that Bitcoin could revisit it soon. The $103,000-$102,000 range is no longer just history; it has become the most important area on the chart right now.
Every day, market moves show that it is weak. There were several attempts to reach higher prices above $116,000 this month, but they did not work. This led to a series of lower highs.
Grim scenario
Today's close near $112,396 shows that demand is still low, and supply continues to limit rebounds. The trading volume has been present enough but not strong enough to suggest that assets are being accumulated.
If the BTC price can climb back above $113,744 soon, the pressure will ease and the chart will stabilize. If it stays under that level, the bands will point directly to the $103,000-$102,000 zone.
For traders heading into November, that range is the key indicator — either as support that holds again or as the line that gives way.
 Dan Burgin
 U.Today Editorial Team