Disclaimer: The opinions expressed by our writers are their own and do not represent the views of U.Today. The financial and market information provided on U.Today is intended for informational purposes only. U.Today is not liable for any financial losses incurred while trading cryptocurrencies. Conduct your own research by contacting financial experts before making any investment decisions. We believe that all content is accurate as of the date of publication, but certain offers mentioned may no longer be available.
Following weeks of intense pressure, XRP broke out of a symmetrical triangle and tested the support zone around $2.70. On the daily chart, a spinning bottom candlestick pattern has surfaced as a possible lifeline, though as it frequently indicates indecision at the end of a downtrend and prepares the market for a reversal.
Given that this candlestick is showing up at such a crucial point, it may indicate that buyers are beginning to overtake sellers. Crucially, XRP is currently trading just above its 100-day moving average, which has historically been a reliable rebound point in this cycle.
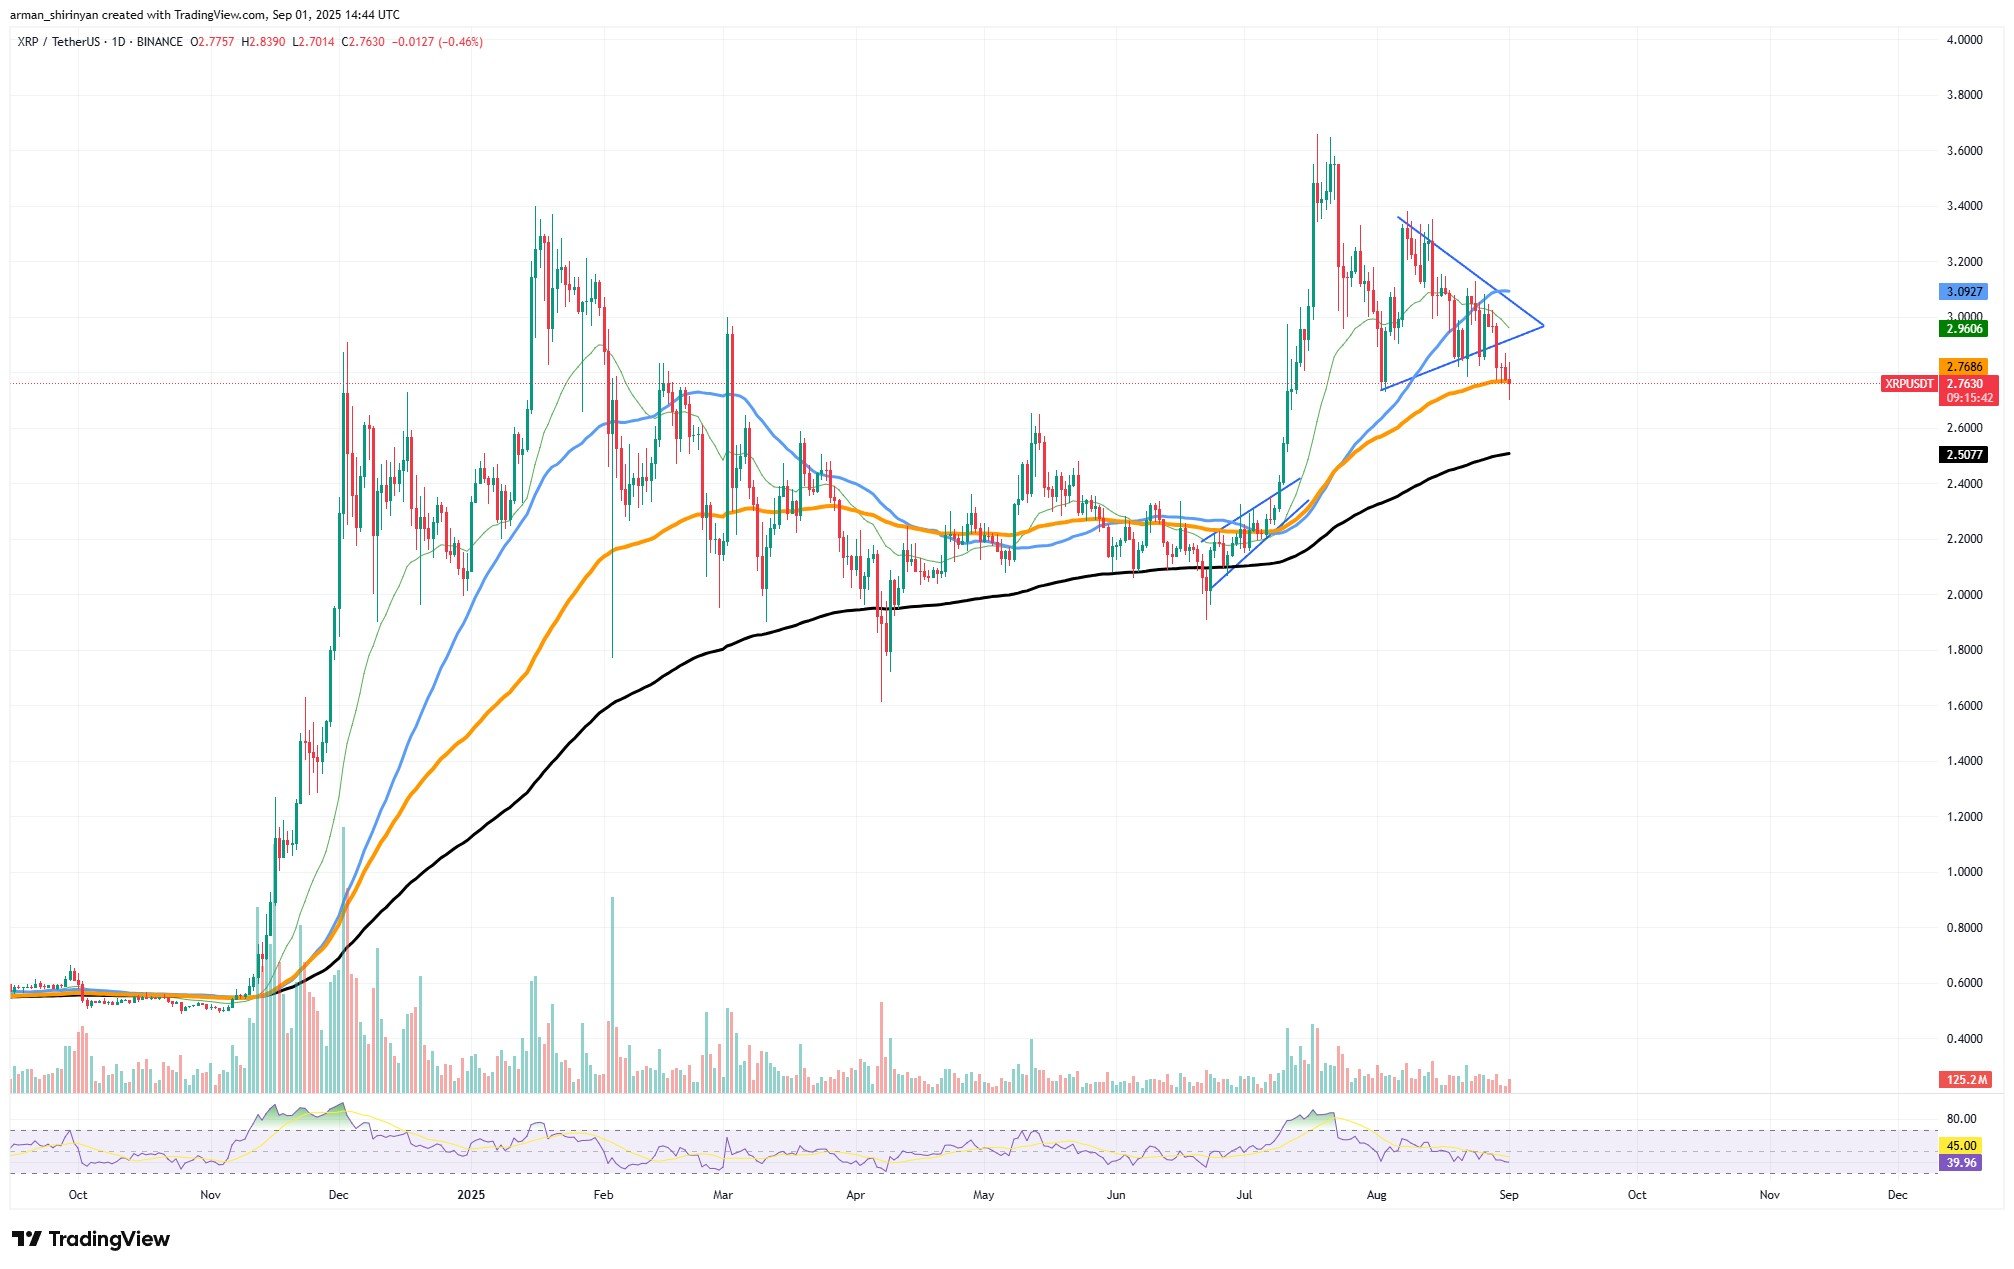
If follow-through purchases are verified, this arrangement might signal the start of a fresh phase of recovery. XRP recently failed to hold the $2.95-$3.00 range, which is the first major resistance in the short term.
The reversal would be confirmed and the path toward $3.10, the upper limit of recent consolidation, would be cleared if there was a break and daily close above this level. The more ambitious goal beyond that is $3.25-$3.30, which corresponds to the descending trendline that capped the most recent triangle formation.
The immediate support on the downside is still $2.70. XRP may move toward the 200-day moving average at $2.50, the bulls’ last line of defense, if it loses this level on high volume, invalidating the reversal pattern.
As of right now, XRP has a good chance of stabilizing and rising, thanks to the candlestick reversal. In the upcoming sessions, traders should keep an eye out for confirmation, particularly regarding the bulls’ ability to convincingly push XRP back above $3.00.
If they are successful, the present spinning bottom may be the pivotal moment that prevents XRP from plunging any lower and reopens the way to growth.
Solana's new dominance?
SOL is currently trading at about $200 on the chart, demonstrating resiliency despite experiencing volatility earlier this year. With the token maintaining above important moving averages and defending its uptrend support, its consistent increase since June is indicative of rekindled investor confidence.
The price movement of Ethereum nowadays is similar to Solana's as Ether is moving in a textbook uptrend with a one higher high after another, which might allow it reach a new height of $5,000. In the case of Solana, it began showing similar signs of heavy accumulation, which might become a foundation for solid growth. Recently, the asset broke $200, an important psychological threshold.
This essentially establishes Solana as a viable substitute for those who feel "late" for Ethereum. Growth is not unavoidable, but there's a solid chance that SOL will pick up ETH's successful market performance we saw in the last few months.
With its extensive liquidity and Layer-2 scaling, Ethereum has solidified its position as the industry standard. But Solana continues to demonstrate that it can sustain security and uptime at scale.
Bitcoin: It's difficult
Given the ongoing selling pressure on the market, Bitcoin (BTC) is seeing one of its most difficult reversal attempts in months. Bitcoin has gone into what can only be described as a free fall after failing to hold above $120,000, and the technical picture indicates that buyers might not see any respite for some time.
Bitcoin has fallen below significant short- and midterm moving averages, including the 50-day EMA, which was once a crucial dynamic support, and is currently trading at about $109,000.
Due to this collapse, Bitcoin now has few areas of immediate support. Near the 200-day EMA at about $104,000 is the next significant cushion. If that level is broken, the structure appears even more shaky, leaving Bitcoin vulnerable to more significant retracements.

A risky situation is created by the absence of solid support areas below the current price. At this point in the rally, Bitcoin is in open space as opposed to earlier when several technical levels offered safety nets for pullbacks.
Because even small selling waves can turn into more aggressive downside moves, this makes any attempt at reversal extremely challenging. The fact that trading volume has not surrendered adds credence to the bearish argument.
Bulls waiting for a bottom signal may become frustrated if Bitcoin grinds lower in a slow bleed in the absence of a strong flush of sellers leaving. RSI and other momentum indicators are still weak, and there isn't any obvious divergence that suggests a bounce is about to happen.
In summary, Bitcoin is currently undergoing one of its most difficult reversal attempts to date. There is little chance of a sustainable recovery in the near future because momentum is strongly against it, and there is no obvious support.
 Dan Burgin
 U.Today Editorial Team