Disclaimer: The opinions expressed by our writers are their own and do not represent the views of U.Today. The financial and market information provided on U.Today is intended for informational purposes only. U.Today is not liable for any financial losses incurred while trading cryptocurrencies. Conduct your own research by contacting financial experts before making any investment decisions. We believe that all content is accurate as of the date of publication, but certain offers mentioned may no longer be available.
Over the past several weeks, XRP, Shiba Inu and Bitcoin have faced furious bearish pressure on the market: XRP, for example, struggled at key moving averages; Shiba Inu attempted to break free from a prolonged triangle formation; and Bitcoin tried to find grounds for a recovery — all without much success. However, the selling pressure is winding down, and sentiment can shift at any given moment.
XRP bears giving up?
Over the past few weeks, XRP has been consistently under bearish pressure, with sellers holding sway after the asset was unable to recover the $3 psychological level. Right now, XRP is trading at about $2.081, just above the 100-day EMA, which has served as a crucial support line. Investors now need to determine if the bears have more fuel in their tanks or if exhaustion is starting to set in.
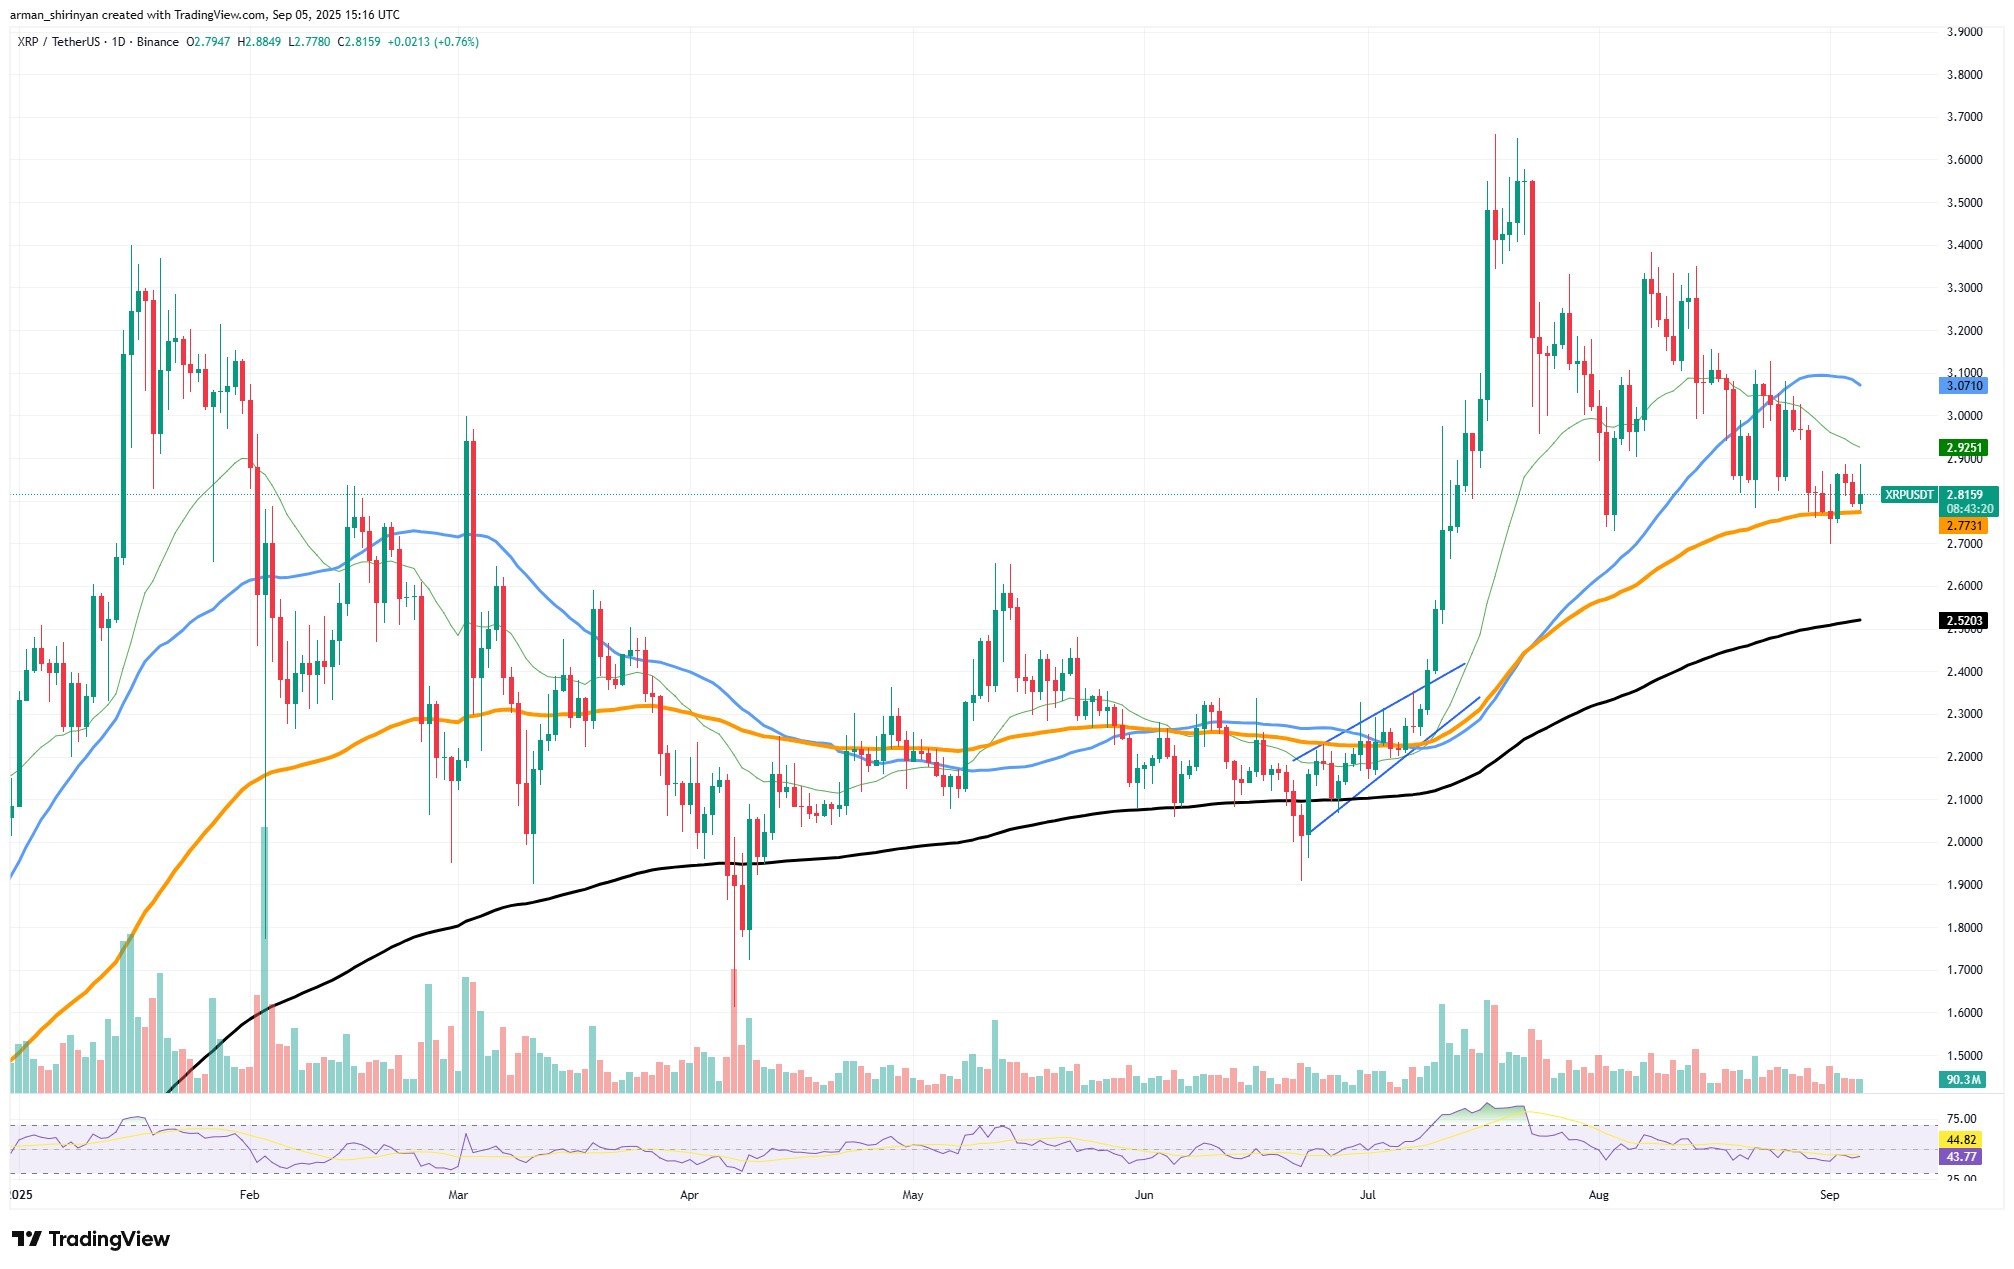
An extended pullback after the July peak near $3.70 is visible on the chart:
XRP has not crashed, as some had anticipated, despite market pressure from lower highs and persistent selling. Rather, buyers appear willing to defend in the $2.75-$2.85 range, where price action has stabilized. This consolidation might indicate that bears are losing ground.
AdvertisementThis outlook is supported by volume data. The declining trading activity suggests a significant slowdown in selling interest. Volume usually rises during breakdowns on bear markets, but the limited participation during XRP’s most recent declines suggests that sellers are losing faith.
Technically, the RSI is at 44, which indicates a slight bearishness but is still well below oversold extremes. This implies that, while there is still potential for a decline, the circumstances for a disastrous plunge are not always present. A more dramatic sell-off below the 200-day EMA seems unlikely in the absence of a significant catalyst, but a decline toward the 200-day EMA at $2.50 is still possible if overall market sentiment deteriorates.
Bitcoin's comeback
Following a decline below $110,000 earlier in the week, Bitcoin has made an unexpected comeback, regaining the $112,000 level. On the surface, such a move might seem bullish, but it is also among the riskiest and least convincing recoveries the asset has displayed in recent months.
With the 50-day EMA close to $115,000 serving as a ceiling, Bitcoin is currently trading between $110,900 and $112,600, just below important resistance levels. It is challenging to categorize this rebound as a strong one because it occurred with a low trading volume. Low-volume recoveries close to crucial price thresholds have a history of losing momentum and resuming downward drift.

Technical indicators draw attention to the degree of uncertainty. However, it does not show much buying enthusiasm, the RSI stays neutral at 45, allowing Bitcoin to rise. In the meantime, the 200-day EMA is at $104,000, which could act as a downside magnet if buyers are unable to hold $110,000. From a psychological standpoint, both bulls and bears now find $112,000 to be an uncomfortable pivot zone.
Although history demonstrates that volatility is frequently preceded by sharp low-volume recoveries, investors may view this as a short-term opportunity. If Bitcoin is unable to break through the $115,000 barrier, it may swiftly return to the $108,000-$106,000 level.
Traders need to exercise caution. Although there is some respite from the recent rebound, it lacks the volume and structural support that usually validates long-term improvements. It might be better for long-term investors to hold off on reevaluating bullish positions until consolidation occurs above $115,000.
To put it briefly, Bitcoin’s $112,000 comeback is surprising but precarious. In the absence of increased volume and momentum, the digital gold could revert, reminding investors that the current market cycle is still dominated by volatility.
Shiba Inu: Cautious optimism
Shiba Inu has spent a large portion of the year in a protracted downward trend, failing to make significant progress as other assets tried to recover. But, at last, a significant positive indication might be showing up on the charts, giving SHIB holders cause for cautious optimism.
SHIB is now trading close to $0.0000122 and has been following a symmetrical triangle pattern that is getting smaller. Significantly, recent candles indicate that sellers might be losing ground as SHIB tries to turn upward from the triangle’s lower boundary. Following weeks of consolidation and numerous setbacks at higher resistance levels, this is the first genuine indication of bullish strength.

The moving averages are starting to come into play as well. SHIB has repeatedly tested the 50-day EMA without breaking sharply lower, indicating that buyers are likely protecting this region. Should momentum persist, SHIB may move in the direction of the 100-day EMA at $0.0000130 and then attempt to break through the 200-day EMA at $0.0000139, a crucial level that would validate a longer-term reversal.
The relative strength index (RSI), which has leveled off at 46 and is suggesting that it may rise, is another positive indication. That permits upward momentum without running the risk of running out of energy right away.
For investors, this suggests that SHIB might be about to enter a transitional phase, where the downward momentum is waning, but it does not ensure a complete breakout. If SHIB closes above the 100-day EMA and stays there, there may be a significant increase in confidence in a short-term recovery.
Although bearish influence has not fully disappeared, the downside momentum across XRP, SHIB and Bitcoin is showing signs of exhaustion. Buyers are defending key levels, but without stronger volume and bullish support, any potential rallies risk losing steam. Until structural support and sustained breakouts above major resistance levels materialize, the market’s current state remains fragile.
 Dan Burgin
 U.Today Editorial Team