Disclaimer: The opinions expressed by our writers are their own and do not represent the views of U.Today. The financial and market information provided on U.Today is intended for informational purposes only. U.Today is not liable for any financial losses incurred while trading cryptocurrencies. Conduct your own research by contacting financial experts before making any investment decisions. We believe that all content is accurate as of the date of publication, but certain offers mentioned may no longer be available.
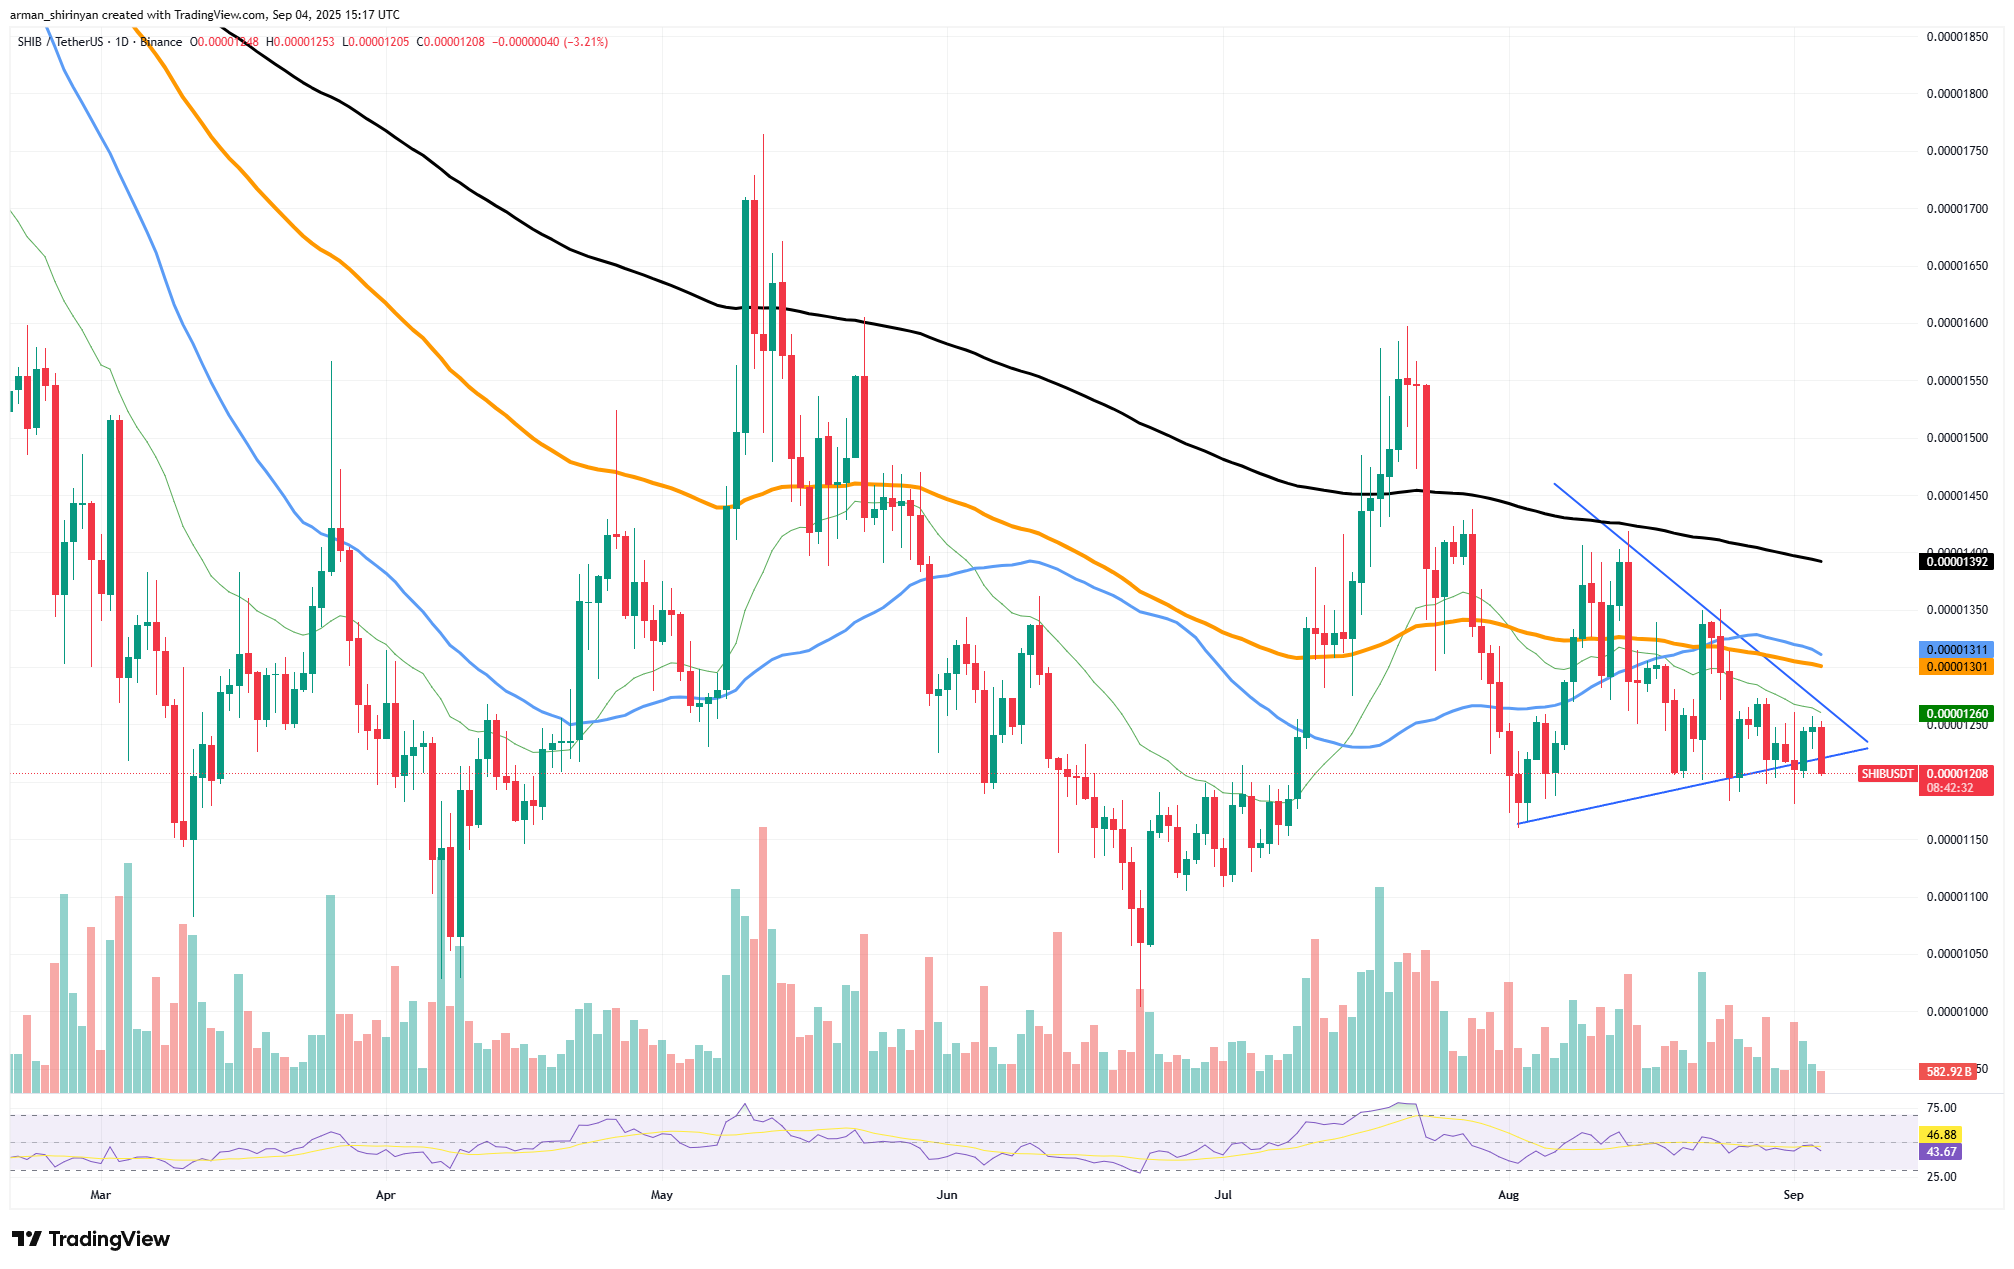
There are only three days left before the price of Shiba Inu is compelled to break out of its current triangle formation, marking a pivotal moment on the charts. The overall situation is not very encouraging for SHIB holders, even though the consolidation has tightened significantly, and the breakout’s path is still unclear.
SHIB's market state
SHIB is caught between a rising support line of higher lows and a descending trendline of lower highs on the daily chart. As the squeeze nears its peak, volatility is typically on the horizon. But traders aren’t exactly lining up for this token. In tandem with price action, volume has been continuously declining, indicating a lack of conviction on the part of both buyers and sellers. The fact that SHIB’s foundations don’t inspire confidence only serves to heighten the gloom.
A consistent drop in network transactions is revealed by on-chain data, indicating a decline in user activity and utility. Declining engagement in the cryptocurrency space frequently results in a drop in price, because fewer users are willing to speculate or transact on the network. The hype-fueled craze that propelled SHIB appears to have faded.

Technically speaking, the main moving averages provide a bearish background. The 200-day moving average (black line) is hovering well above the price, and SHIB is being pressured by the 50-day and 100-day averages, which serve as resistance layers. The fact that the 20-day moving average has also turned into overhead pressure indicates that the short-term momentum is not in favor of the bulls.
SHIB stays trapped
SHIB is still trapped in a downward drift unless it can make a convincing break above the $0.000013 zone. The Relative Strength Index (RSI) shows no indication of hidden strength and floats around neutral levels. There is a greater chance of a breakdown than a breakout in the absence of a spike in volume or renewed interest.
SHIB could revert to the $0.000010 level, or worse if support at $0.000012 is not met. Traders should brace for volatility as this triangle closes in three days, but there isn’t much hope. The path of least resistance is downward, and SHIB may soon show its hand unless there is a fundamental shift.
 Dan Burgin
 U.Today Editorial Team