Disclaimer: The opinions expressed by our writers are their own and do not represent the views of U.Today. The financial and market information provided on U.Today is intended for informational purposes only. U.Today is not liable for any financial losses incurred while trading cryptocurrencies. Conduct your own research by contacting financial experts before making any investment decisions. We believe that all content is accurate as of the date of publication, but certain offers mentioned may no longer be available.
It will be clear in the next 48 hours whether the recent decline in Bitcoin and the cryptocurrency market as a whole is the start of a long-term downtrend or a temporary technical flush. The short- and midterm price structure signals show mounting tension beneath the surface, as volatility subtly increases before more significant movements take place.
Steps to normalization
Only in retrospect do most traders identify a crash. Finding out how market stress builds up before it breaks is the key to differentiating between anticipation and reaction. Data from the recent sell-off and the August all-time high show how Bitcoinvectors Flash Crash Alerts can differentiate between deeper structural weakness and temporary stress, in order to detect early volatility shocks.
Stress local: Flash crash warning
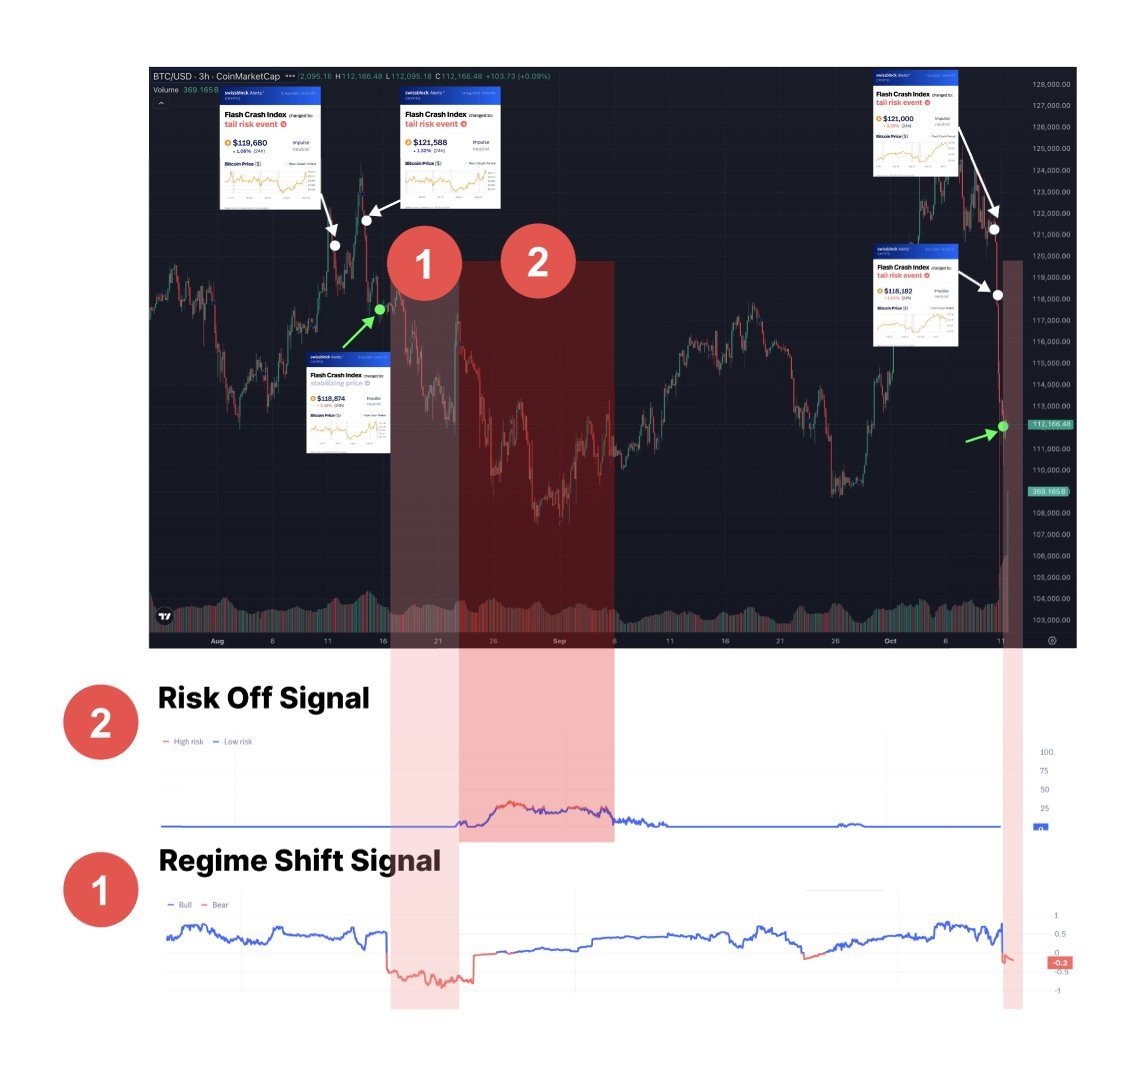
Visible panic is rarely the first sign of a market breakdown. Initially, it is localized stress that permeates the order book. Many hours prior to the major move, the Flash Crash Alert records these early-stage volatility spikes. While price action remained surprisingly stable, alerts were set off well before the crash in August and the most recent event, identifying concentrated downside pressure. By providing an early defensive mechanism, this early signal allows traders to limit exposure prior to widespread capitulation.
Stabilization: The end of panic
In order to determine when selling pressure has subsided, Bitcoinvectors monitors volatility compression after liquidation waves. Diminished local stress during this Stabilizing Price phase suggests that short-term panic may be coming to an end, and that market recalibration may be starting. This stage determines whether a recovery is real or just a short-term one. The signal offers a framework for determining if the circumstances call for maintenance of caution or permit reentry.
Currently, the market is defined by two indicators. A bearish turn in the volatility skew that indicates the start of structural change is known as a Regime Shift Signal.
Risk-off signal: Verification of systemic decline and extended contraction of liquidity
The August collapse confirmed a complete structural breakdown, as both signals were activated. On the other hand, the recent sell-off has only resulted in the Regime Shift Signal, which suggests increased stress but no systemic failure.
 Dan Burgin
 U.Today Editorial Team