
Disclaimer: The opinions expressed by our writers are their own and do not represent the views of U.Today. The financial and market information provided on U.Today is intended for informational purposes only. U.Today is not liable for any financial losses incurred while trading cryptocurrencies. Conduct your own research by contacting financial experts before making any investment decisions. We believe that all content is accurate as of the date of publication, but certain offers mentioned may no longer be available.
The market is rapidly losing traction as XRP and Bitcoin clearly showing problematic tendencies: Bitcoin is losing steam with RSI reversing down, and XRP is moving steadily in a descending price channel. On the other hand, Ethereum could be ready to hit the $5,000 mark sooner than anticipated.
XRP struggling, but can blow up
As the asset continues to struggle inside a descending channel that has been pushing it lower for weeks, XRP’s price action is giving holders cause for concern. XRP is currently trading close to $2.97 after losing the crucial $3 mark, and technical indicators imply that more suffering might be on the way.
With lower highs continuously pushing XRP into a condensed trading range, the chart displays a clearly defined downward-sloping channel. Because selling pressure is applied at the descending resistance line to every attempt at a rebound, this structure frequently indicates bearish continuation.
The psychological blow caused by the break below $3 increases the likelihood of a more significant retracement the longer XRP is unable to recover this level.
Advertisement
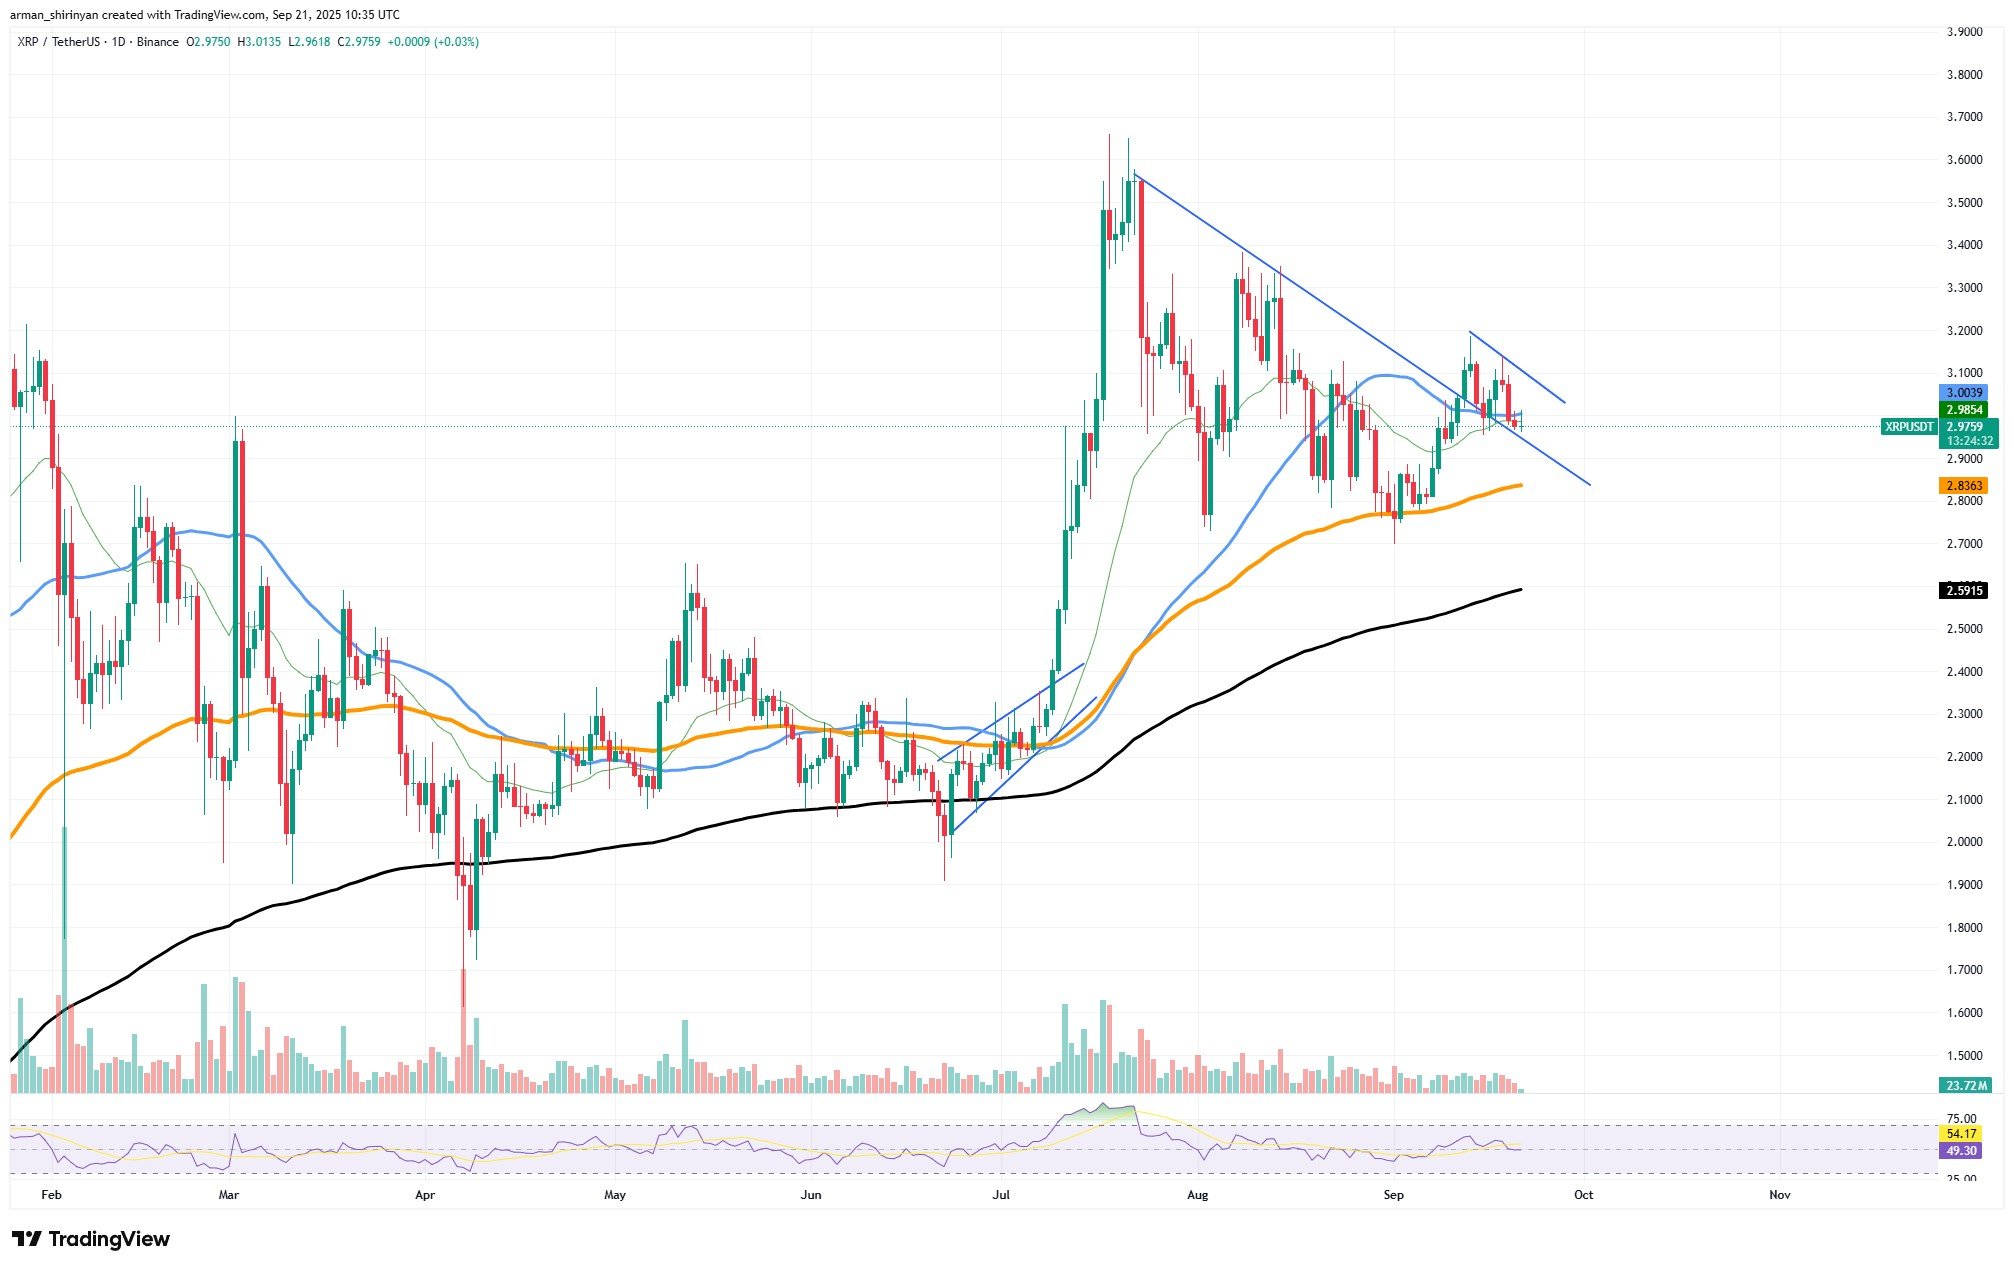
Additionally, the moving averages are not providing much respite. The 200-day EMA (black), which is still well below current prices and could serve as a long-term support zone around $2.58, is tilting downward. In a more bearish extension, XRP might be pulled closer to the $2.50-$2.60 range, and if selling momentum increases, it might return to the $2.80 zone.
The absence of significant buying volume is another factor contributing to the pressure. The lack of conviction in recent rallies indicates that market players are hesitant to intervene forcefully at the current levels. Before XRP reaches oversold territory, there is still opportunity for decline as indicated by the mid-range RSI.
A breakout above $3.10-$3.20 would be necessary for bulls to change their stance and test the channel’s upper boundary. The path of least resistance continues to be downward in the absence of it.
In summary, the technical structure of XRP indicates that it may continue to decline. Should the descending channel continue, the asset may find itself moving closer to $2.80 and then $2.50, which would negate a large portion of its recent bullish recovery.
Bitcoin enters stalemate?
The price of Bitcoin is stalling at about $115,745, suggesting that the most recent rally may be coming to an end. Bitcoin is currently exhibiting warning signs that the momentum may be waning following a steady recovery from September lows.
Among the most obvious warning signs is the Relative Strength Index (RSI), which has begun to turn around after momentarily approaching overbought levels. At this point, the indicator is in a neutral range, suggesting that buying pressure is waning. RSI reversals at the peak of local rallies frequently signal a pullback, particularly when price action is having difficulty pushing higher.
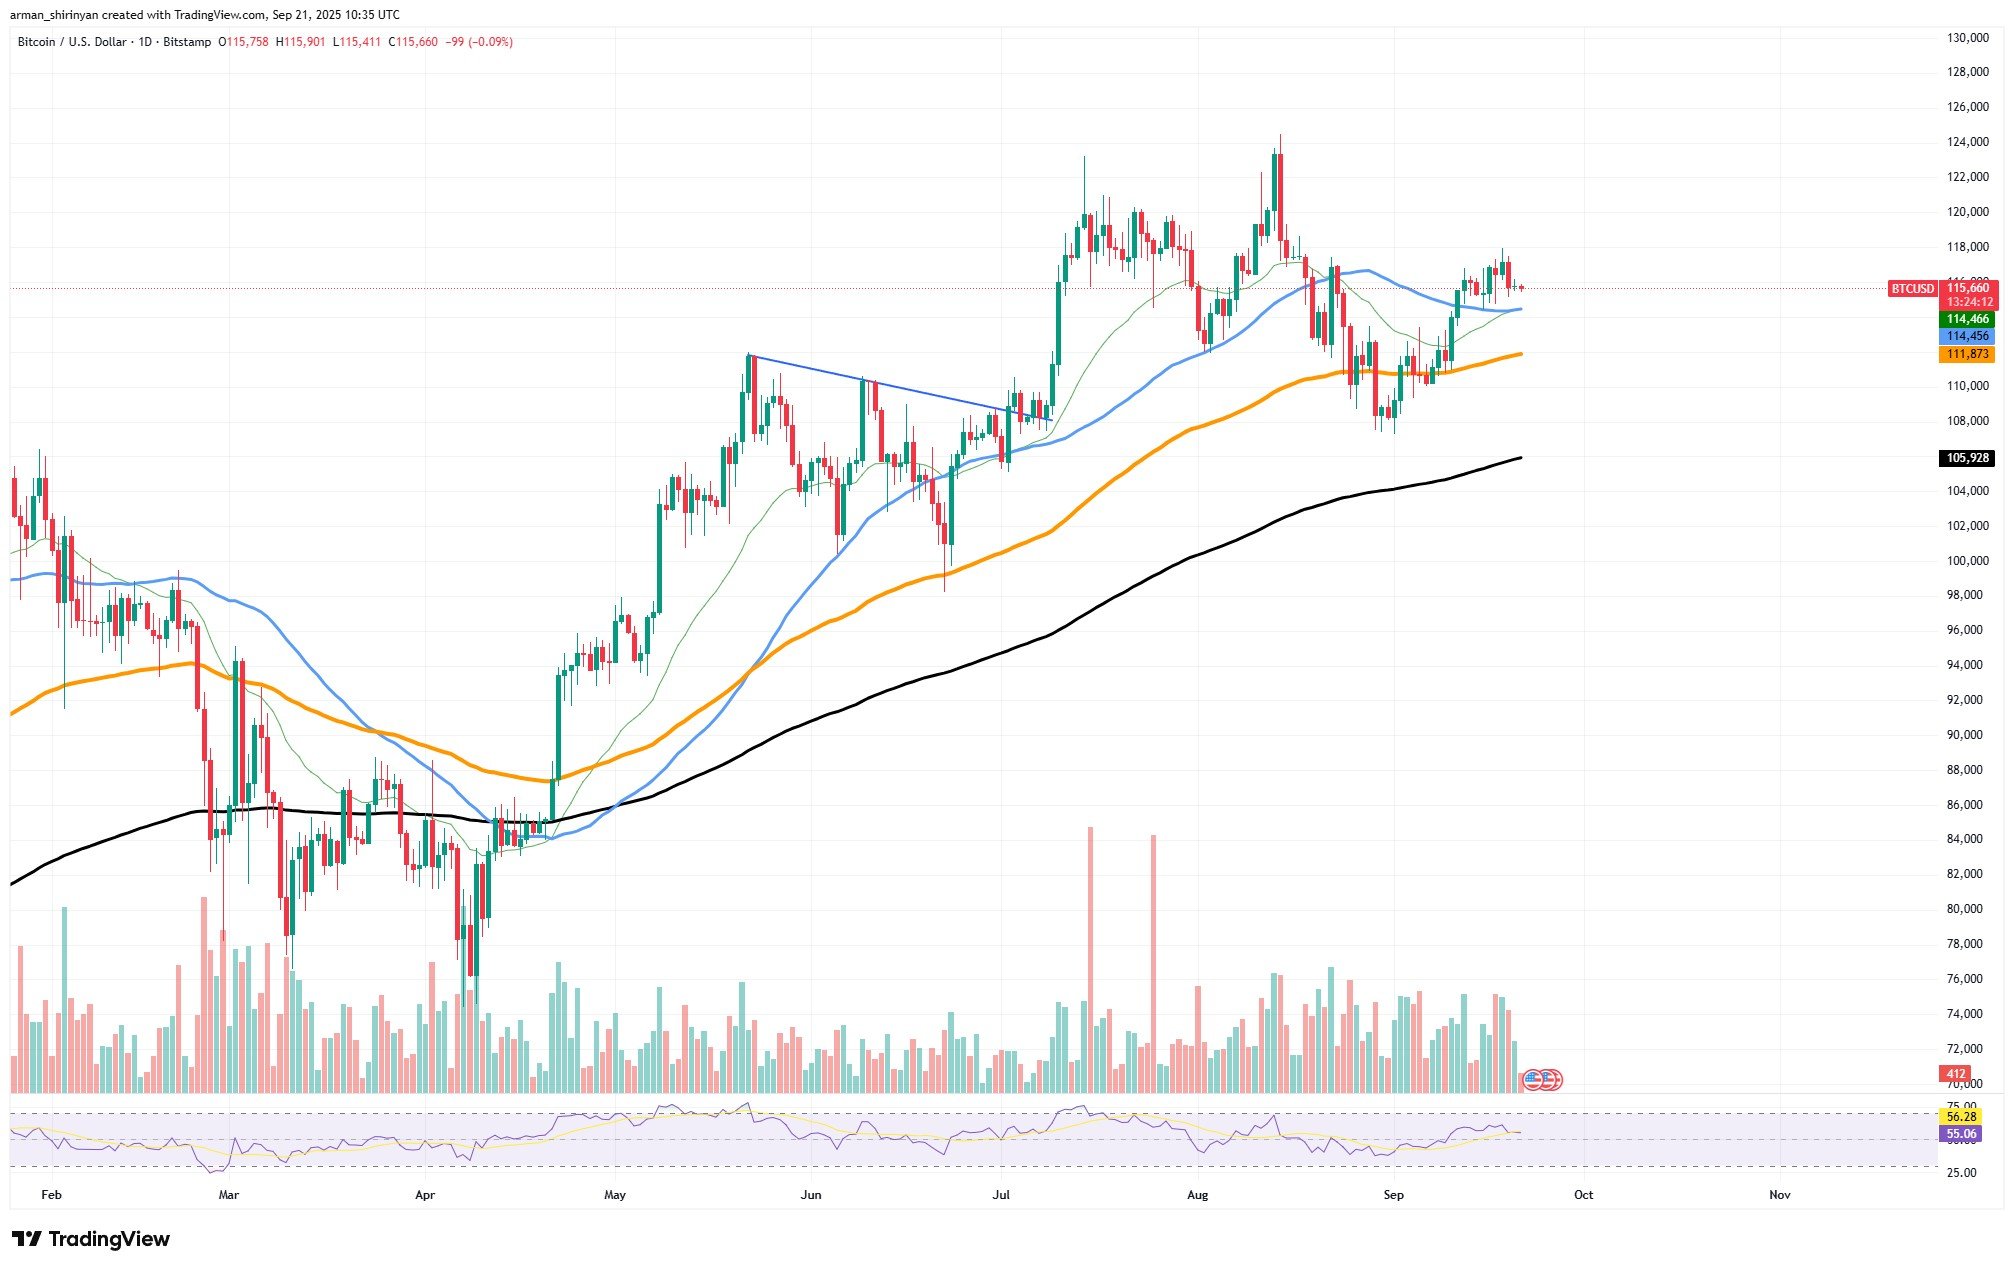
The low volatility at present levels is another issue. Nearing its local peak, Bitcoin is trading in a narrow range, which typically denotes indecision. Traders lock in profits when this kind of sideways chop near resistance resolves with a downside break. Volume also shows this cooling momentum, as activity spikes are diminishing, making a retracement of the market possible.
Technically, the 20-day EMA (green) has served as short-term support, but if selling pressure increases, the larger structure points to a potential retest of the 50-day EMA (blue) at $114,000, or even the 200-day EMA (black) at $105,900. Losing these levels would indicate that this rally was only a relief bounce and not the beginning of a long leg higher, so it’s important to keep an eye on them.
Bitcoin seems more exhausted than strong at its current consolidation level around $115,745. The most likely scenario is a short-term pullback with downside targets between $114,000 and $112,000 unless buyers quickly regain momentum. Bitcoin may experience a more severe correction back toward the $106,000 mark if macro liquidity also cools.
Ethereum's hidden power
Ethereum appears to be poised for a significant volatility breakout as it coils up inside a symmetrical triangle. Since the price of ETH is currently trading above $4,450, a significant move could occur soon, and $5,000 is still the obvious upward target.
The daily chart shows that ETH has been steadily rising since the middle of summer, helped along by the green 20-day and blue 50-day EMAs. The upward slope of these moving averages indicates that the trend is still very strong. More significantly, the triangle pattern’s price compression indicates that the market is getting ready to expand. Such consolidations have historically ended with explosive volatility, frequently pushing ETH into a new trading range.
The upper boundary of the triangle meets recent rejection candles at the key breakout level, which is located between $4,600 and $4,700. It appears very likely that ETH will make a quick run toward $5,000 if it breaks above this zone with volume confirmation. The asset would probably be pulled back toward the 200-day EMA at about $3,850 if the $4,300-$4,250 support band were broken, invalidating the bullish structure.
The Relative Strength Index (RSI), which is still neutral and indicates that there is still space for buyers before the situation becomes overextended, supports the bullish argument. With momentum accelerating without overheating, ETH is now in a sweet spot.
While market sentiment will be a factor, Ethereum’s own fundamentals — particularly DeFi activity and staking flows — will be the main driver. ETH might be the asset to take the lead in the upcoming market segment, since Bitcoin is beginning to show signs of exhaustion.
The triangle of Ethereum is, in essence, the quiet before the storm. If bulls seize the breakout, traders should be ready for significant volatility in the future, with $5,000 firmly in play.
 Dan Burgin
 U.Today Editorial Team