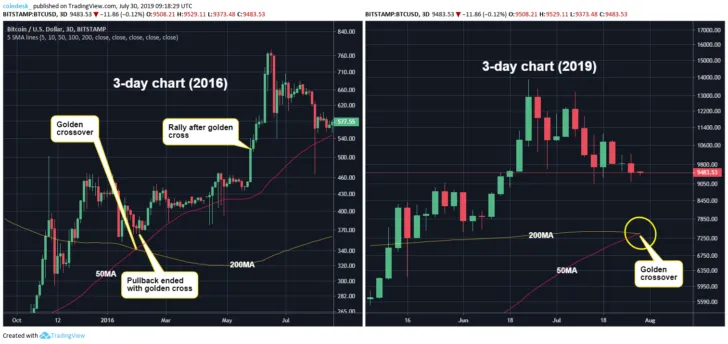
According to Coindesk’s analyst Omkar Godbole, Bitcoin has formed a golden cross on its three-day chart, its first since February 2016. It signals a possible trend reversal that could lead to the BTC price reaching a brand-new ATH.

Aiming for the moon
Last time when the 50-day moving average rose above 200-day moving average marked the start of a major bull run that resulted in Bitcoin reaching its current ATH of $20,000 back in December 2017. Hence, the bulls have high expectations this time around.
Speaking of the short-term, golden cross is very likely to put an end to the brutal sell-off (just like it did in 2016). Godbole points out that the BTC price could soon reach $10,000 given how exhausted sellers feel, but a trend reversal will be confirmed once it touches the bearish lower high of $11,120.
At the time of writing, the Bitcoin price is sitting at $9,680.82 after a minor 1.26 percent increase, according to CoinMarketCap data.
The halvening hype
Bitcoin halving, which will take place at the end of May 2020, is widely considered to be the main driving factor behind the expected price growth. The reduction of mining rewards serves as a stark reminder that Bitcoin is primarily valued because of its scarcity.
Meanwhile, Litecoin, the silver to Bitcoin’ gold, is expected to halve its halving event as early as at the beginning of August.

 Arman Shirinyan
 Dan Burgin
 Alex Dovbnya
 Denys Serhiichuk