Disclaimer: The opinions expressed by our writers are their own and do not represent the views of U.Today. The financial and market information provided on U.Today is intended for informational purposes only. U.Today is not liable for any financial losses incurred while trading cryptocurrencies. Conduct your own research by contacting financial experts before making any investment decisions. We believe that all content is accurate as of the date of publication, but certain offers mentioned may no longer be available.
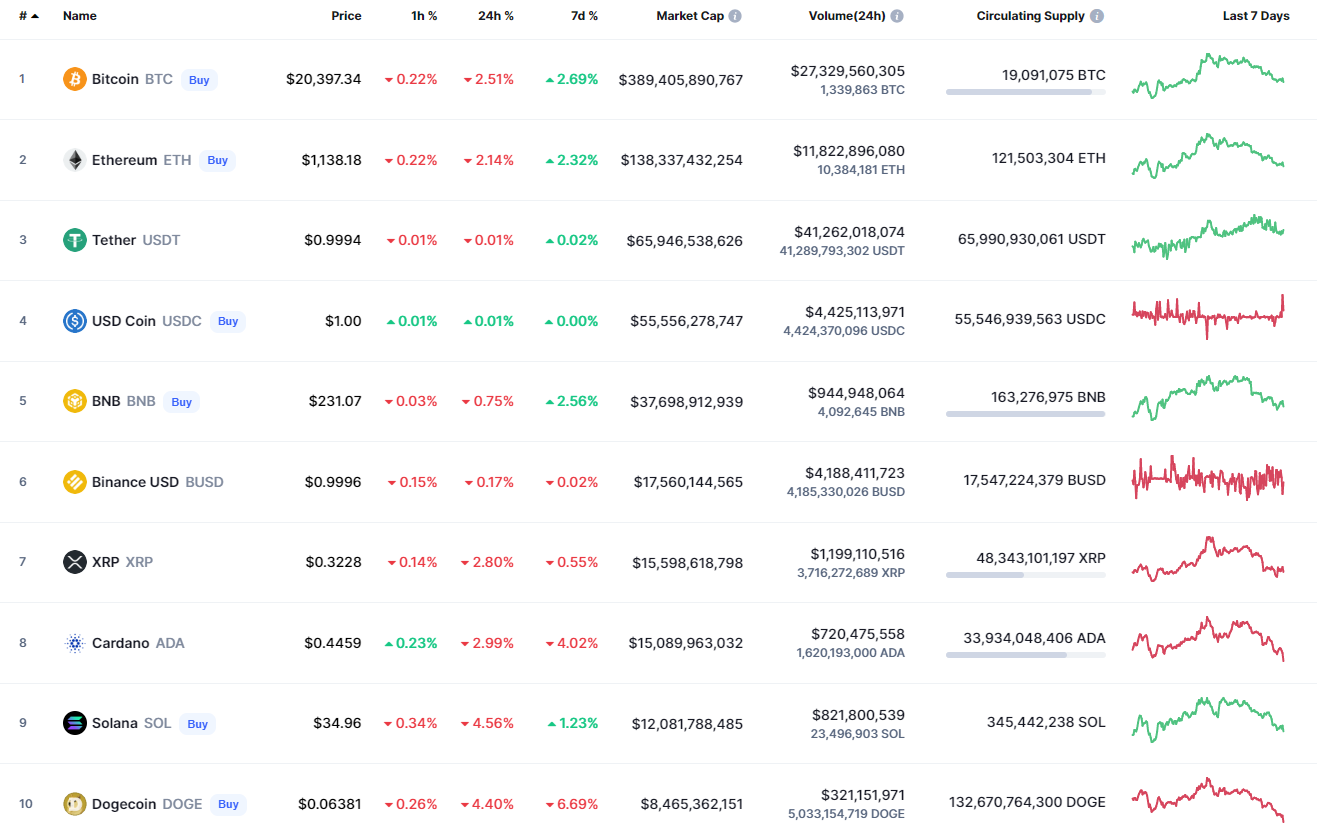
The new week has started with the fall of the cryptocurrency market as the majority of the coins are in the red zone.
BTC/USD
The price of Bitcoin (BTC) has declined by 2.55% over the last 24 hours.
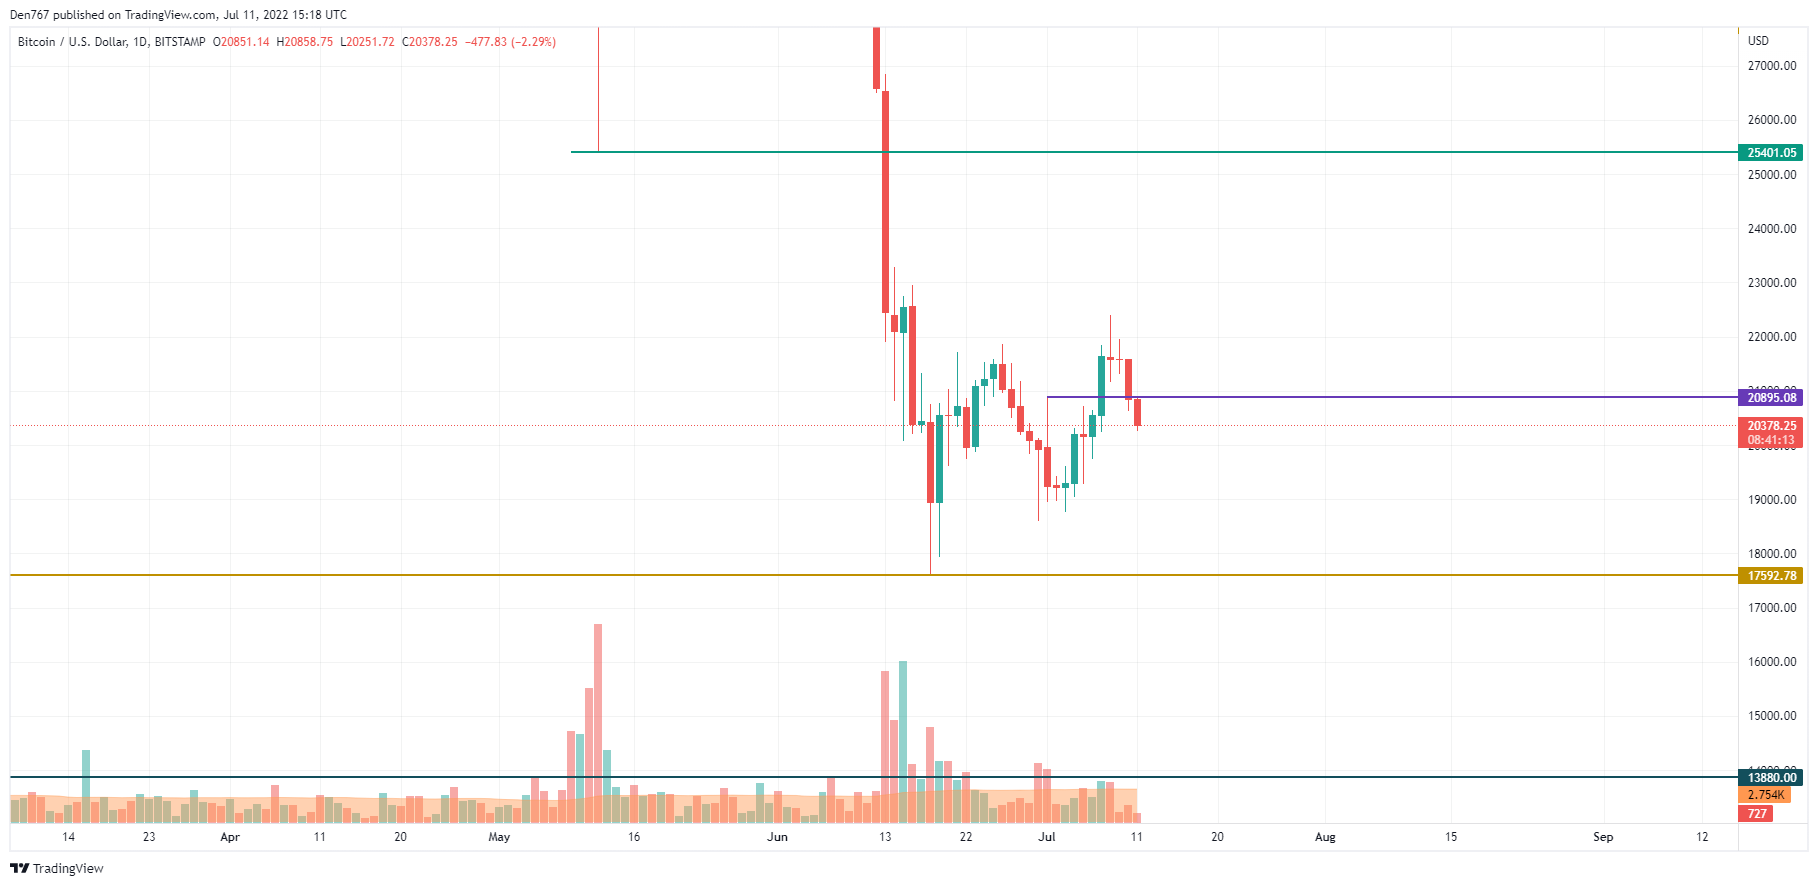
Bitcoin (BTC) has continued the fall after yesterday's bullish candle and breakout of the local support level at $20,895. The selling volume remains low; however, if bears keep their pressure, there is a chance to see a further drop below the vital zone of $20,000. Such a scenario is relevant until the end of the week.
Bitcoin is trading at $20,395 at press time.
SOL/USD
Solana (SOL) is the biggest loser today as it has decreased by 4.72%.
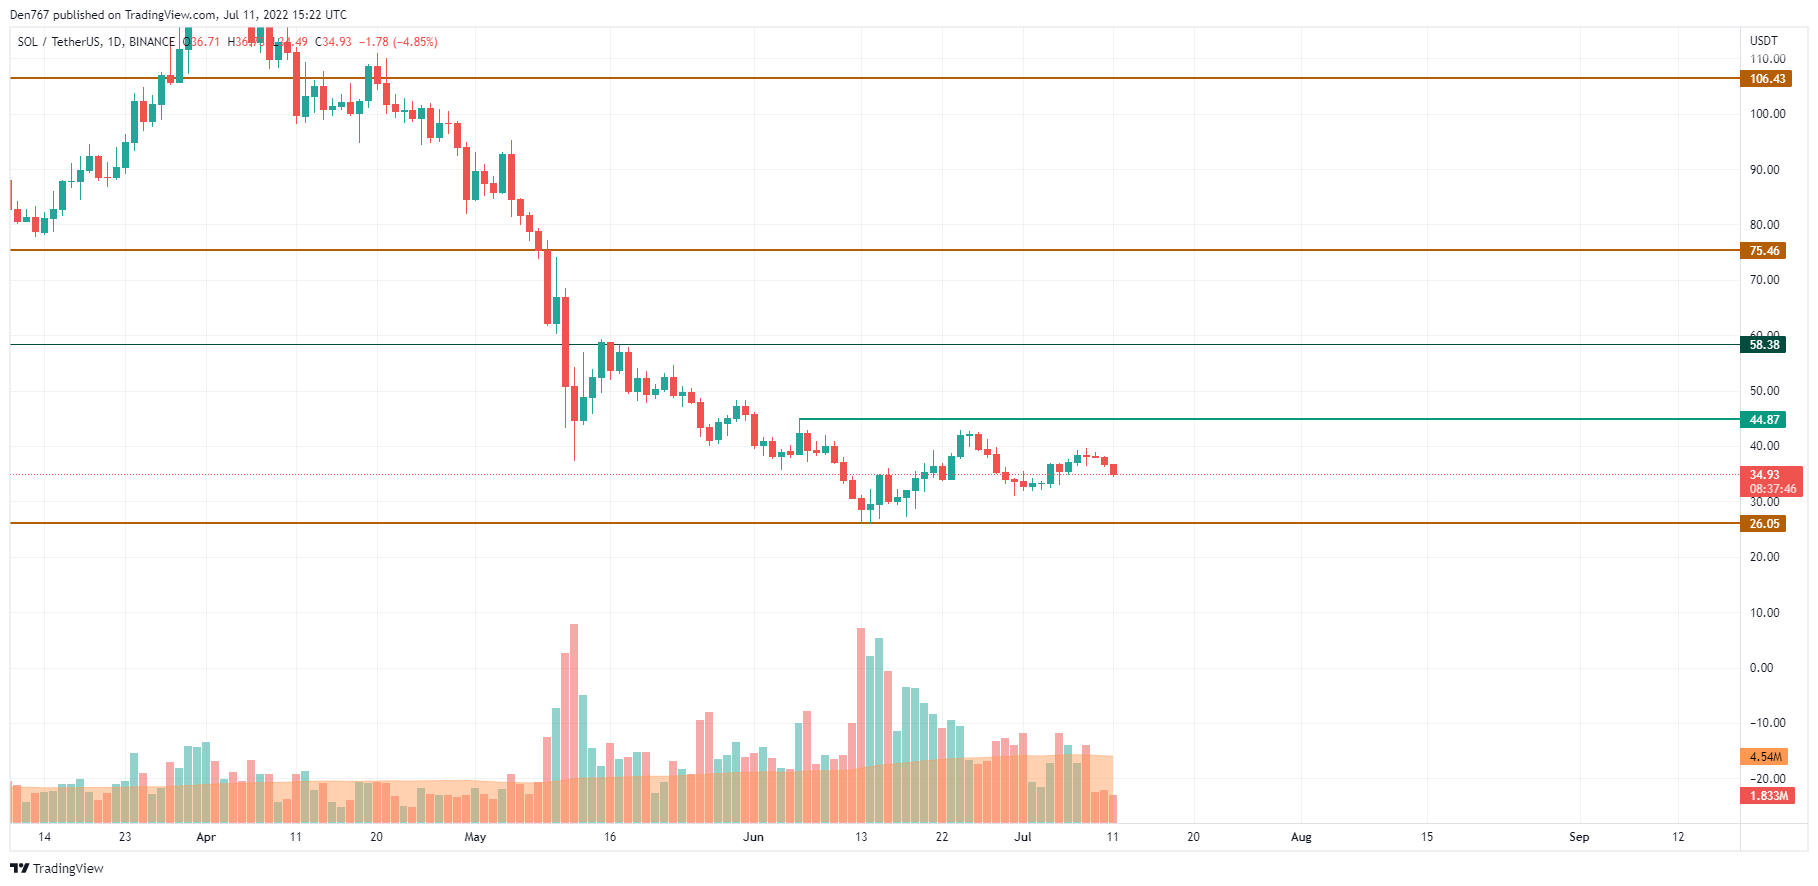
Despite today's drop, Solana (SOL) is trading in the middle of the wide channel between the support level at $26.05 and the resistance at $44.87. At the moment, bears seem to be more powerful than bulls as the price could not fix above the $40 mark. If SOL loses another level at $30, one can expect the test of $20 soon.
SOL is trading at $34.87 at press time.
AVAX/USD
Avalanche (AVAX) has followed the decline of the whole market, going down by 4.34%.
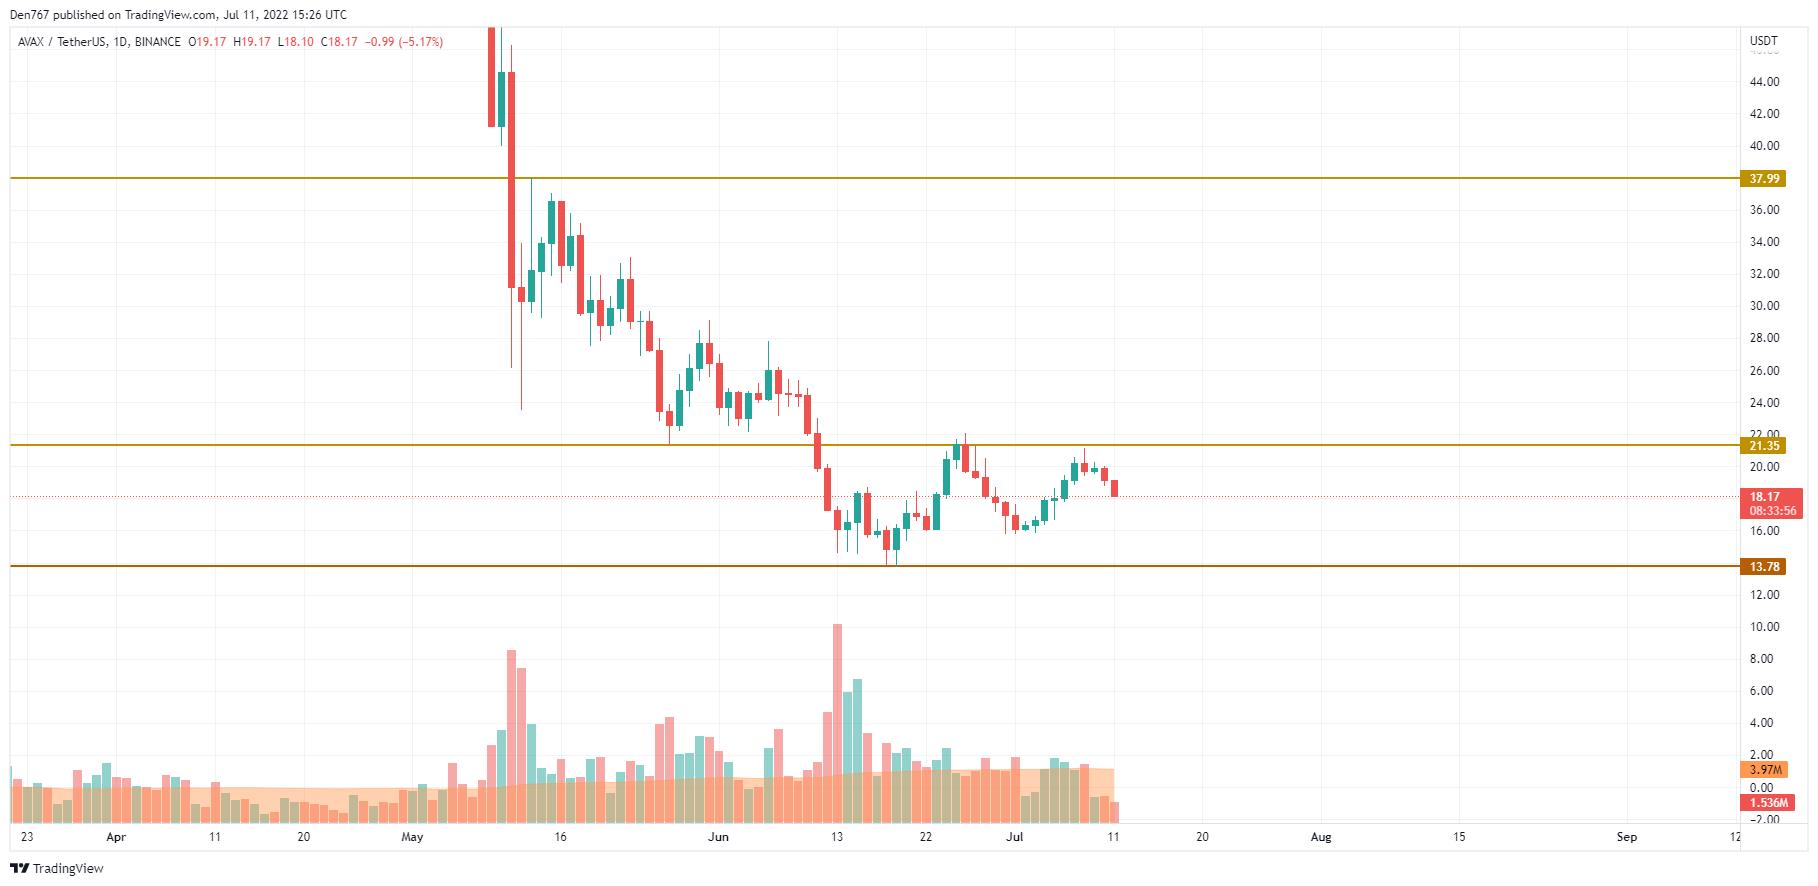
Avalanche (AVAX) is looking similar to SOL as the sideways trading remains the more likely scenario for the upcoming days. However, if the daily candle fixes near the $18 mark or below it, bears have chances to seize the initiative.
AVAX is trading at $18.18 at press time.
 Dan Burgin