Disclaimer: The opinions expressed by our writers are their own and do not represent the views of U.Today. The financial and market information provided on U.Today is intended for informational purposes only. U.Today is not liable for any financial losses incurred while trading cryptocurrencies. Conduct your own research by contacting financial experts before making any investment decisions. We believe that all content is accurate as of the date of publication, but certain offers mentioned may no longer be available.
Yesterday the price of Bitcoin increased from $8,150 to $8,600 just in two hours. Surprisingly, the top coins followed the growth of BTC that did not happen before. Moreover, the rates of some altcoins have risen more than the leading crypto. The biggest gainers are Binance Coin and Bitcoin SV whose prices have gone up by 9.34% and 9.38% respectively over the last 24 hours.
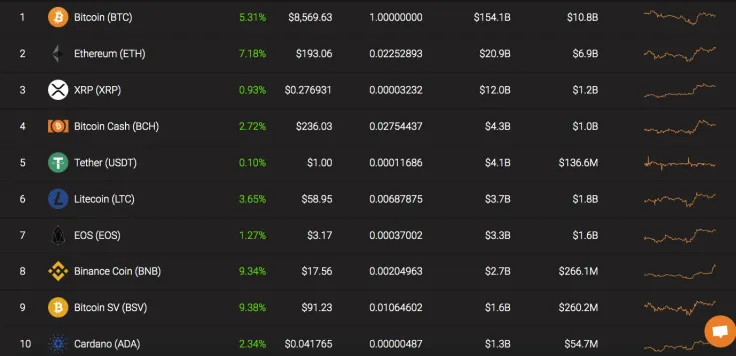
Concerning Bitcoin, the growth of the rate was accompanied by the rising of the trading volume. Also, the rise keeps located in a short-term uptrend against the SEC's Bitcoin ETF rejection.
Name: Bitcoin
Ticker: BTC
Market Cap: $154 149 735 716
Price: $8 571,62
Volume (24h): $20 192 823 576
Change (24h): 5,31%
The data is relevant at the press time.
BTC/USD: No Reaction So Far on SEC's Bitcoin ETF Decision
Our recent Bitcoin price forecast more than justified itself as the price overpassed the $8,200 mark and fixed above $8,500.
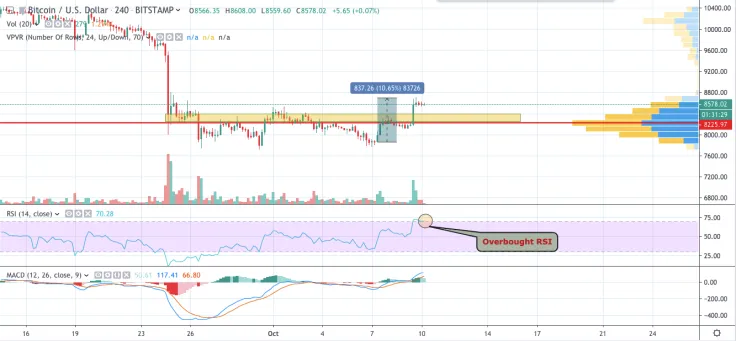
On the 4H chart, Bitcoin has increased by more than 10% over the last two days. The short-term scenario remains bullish, as MACD is moving upward. However, there is a high chance to see BTC trading in a sideways trend because the RSI indicator is located in the overbought area.

All in all, the rate of the leading crypto is likely to locate in the yellow range as it is outlined on the chart.
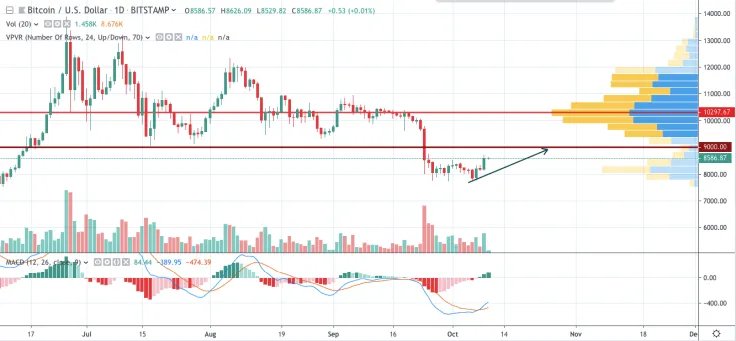
On the bigger timeframe, the situation is more positive. The blue line of MACD crossed the red one, assuming the trend change. The last bullish candle absorbed the bearish one, which also supports the dominance of buyers. In this case, one may expect Bitcoin trading at $9,000 until the end of October.
Bitcoin is trading at $8,586 at press time.
 Dan Burgin
 U.Today Editorial Team