TRON outperformed yet another coin today and secured the number 8th spot in the rankings by market cap. After moving ahead of Bitcoin SV just a couple of days ago, today it was Tether’s turn to succumb to the pressure, albeit for a very thin margin: TRON market cap $1,957,545,913, Tether market cap: $1,931,671,398 (data from CoinMarketCap).
This new flippening comes just a day after TRON announced they’ve hired David Labhart, who is a former US Securities and Exchange Commission (SEC) supervisory attorney, as first chief compliance officer and co-general counsel. It’s unclear whether this was the catalyst behind the price increase, but it’s certainly good news for TRX.
Chart Analysis – TRX/USD
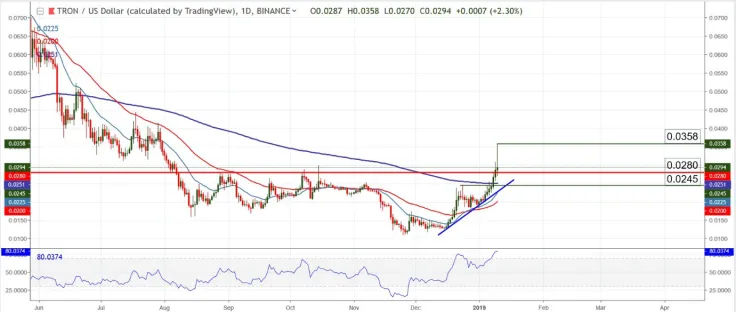
Without a doubt TRX is the best performer of the year to date, adding more than 46% during the last 7 days and spiking to a high of 0.0358 against the US Dollar. However, many of the gains were erased and now the pair is testing the support/resistance level at 0.0280.

The last candle is showing a very long wick in its upper part, which is almost always a clear sign of rejection. On top of this, the Relative Strength Index is overbought on several time frames, including the Daily chart above and all this evidence points towards a potential drop below the previous resistance level (0.0280) and into the 200 days Exponential Moving Average (thick blue line on chart).
After said retracement is complete, the pair is likely to move again towards the previous high at 0.0358. Our view is bullish as long as the blue trend line seen on the chart remains intact.
Support zone: 0.0245, the bullish trend line and 200 EMA
Resistance zone: 0.0358 (also, 0.0280 can turn into resistance if the price drops below it)
Most likely scenario: retracement that finds support at 0.0245, 200 Days EMA and/or bullish trend line
Alternate scenario: break below 0.0245 followed by a stagnation period
 Caroline Amosun
 Tomiwabold Olajide
 Godfrey Benjamin