Monday, Apr. 15 has started with a new bullish wave, recovering the positions of the previous week.
Regarding the fundamental factors, investors have increased the number of long positions on Bitcoin by 88%, which is a confirmation of a long-term bullish run.
Among the top 3 coins, Ethereum has shown the biggest growth, having increased by approximately 3.2% by the past 24 hours.
In this regard, the BTC’s domination rate went down and now constitutes 51.8%
BTC/USD
At the beginning of last week, we saw an increase, but then there was a rollback to the support level of $5,000. Currently, the resistance zone is at $5,436. If the price breaks through this point, this mark will serve as a good entry opportunity.
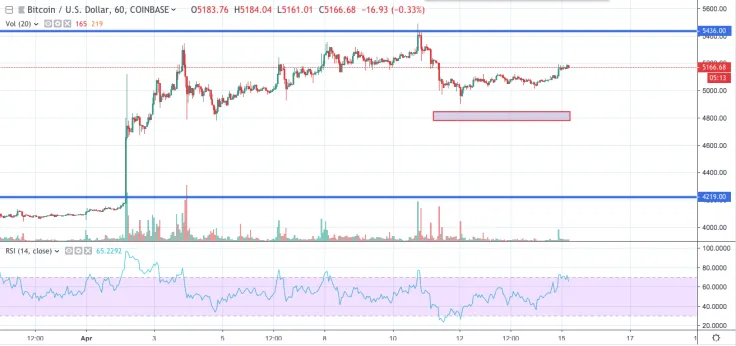
On the other hand, although the RSI indicator shows a bullish sign, it is in the overbought area. Based on this data, one can say that pullback is still possible. While it is difficult to judge the depth of the correction, it is worth focusing on the support zone of $,4784 - $ 4,845.
In addition, although now it seems unlikely, we should not forget about the possible breakdown of this support. If this occurs, then the price may drop to $4,219.
The price of BTC is trading at $5,194.82 at the time of writing.
ETH/USD
After the breakdown of the level of $156, the mark of $184 became a serious resistance, and it was not possible to break through it.
At the moment the rate has fixed at around 0.38 Fibonacci retracement. If the price passes this mark down with a break of the 20-day EMA, this will serve a bearish sign.
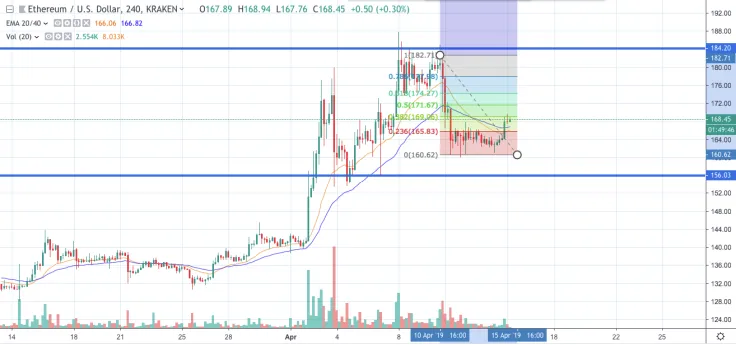
What is more, the number of traders making bets against Ethereum (ETH) dropped to a record low, indicating a sharp change in investor sentiment.
The price of ETH is trading at $168.11 at the time of writing.
XRP/USD
The nature of the XRP quotes, as well as the MACD indicator and the RSI oscillator, show a recruitment position.
However, there is no demand for high levels of Ripple. Each upward movement is extinguished, which leads to fluctuations within the range of $0.31- $0.36.
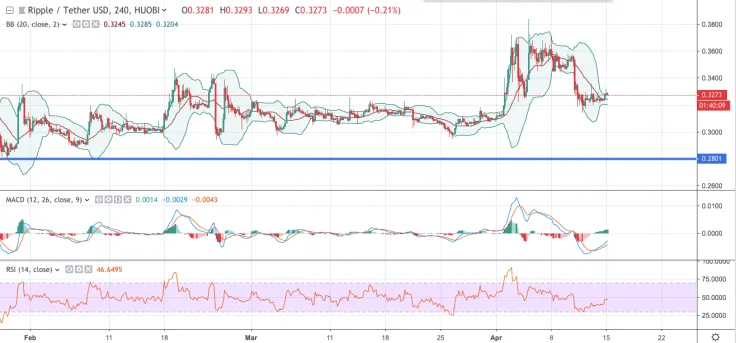
The probability that the price will fall below $0.28 is extremely low. In this case, the Bollinger bands indicate the divergence of the channel. This can serve as a good reason for the test mark of $0.41, followed by consolidation above the level.
The price of XRP is trading at $0.3291 at the time of writing.
 Dan Burgin