
Disclaimer: The opinions expressed by our writers are their own and do not represent the views of U.Today. The financial and market information provided on U.Today is intended for informational purposes only. U.Today is not liable for any financial losses incurred while trading cryptocurrencies. Conduct your own research by contacting financial experts before making any investment decisions. We believe that all content is accurate as of the date of publication, but certain offers mentioned may no longer be available.
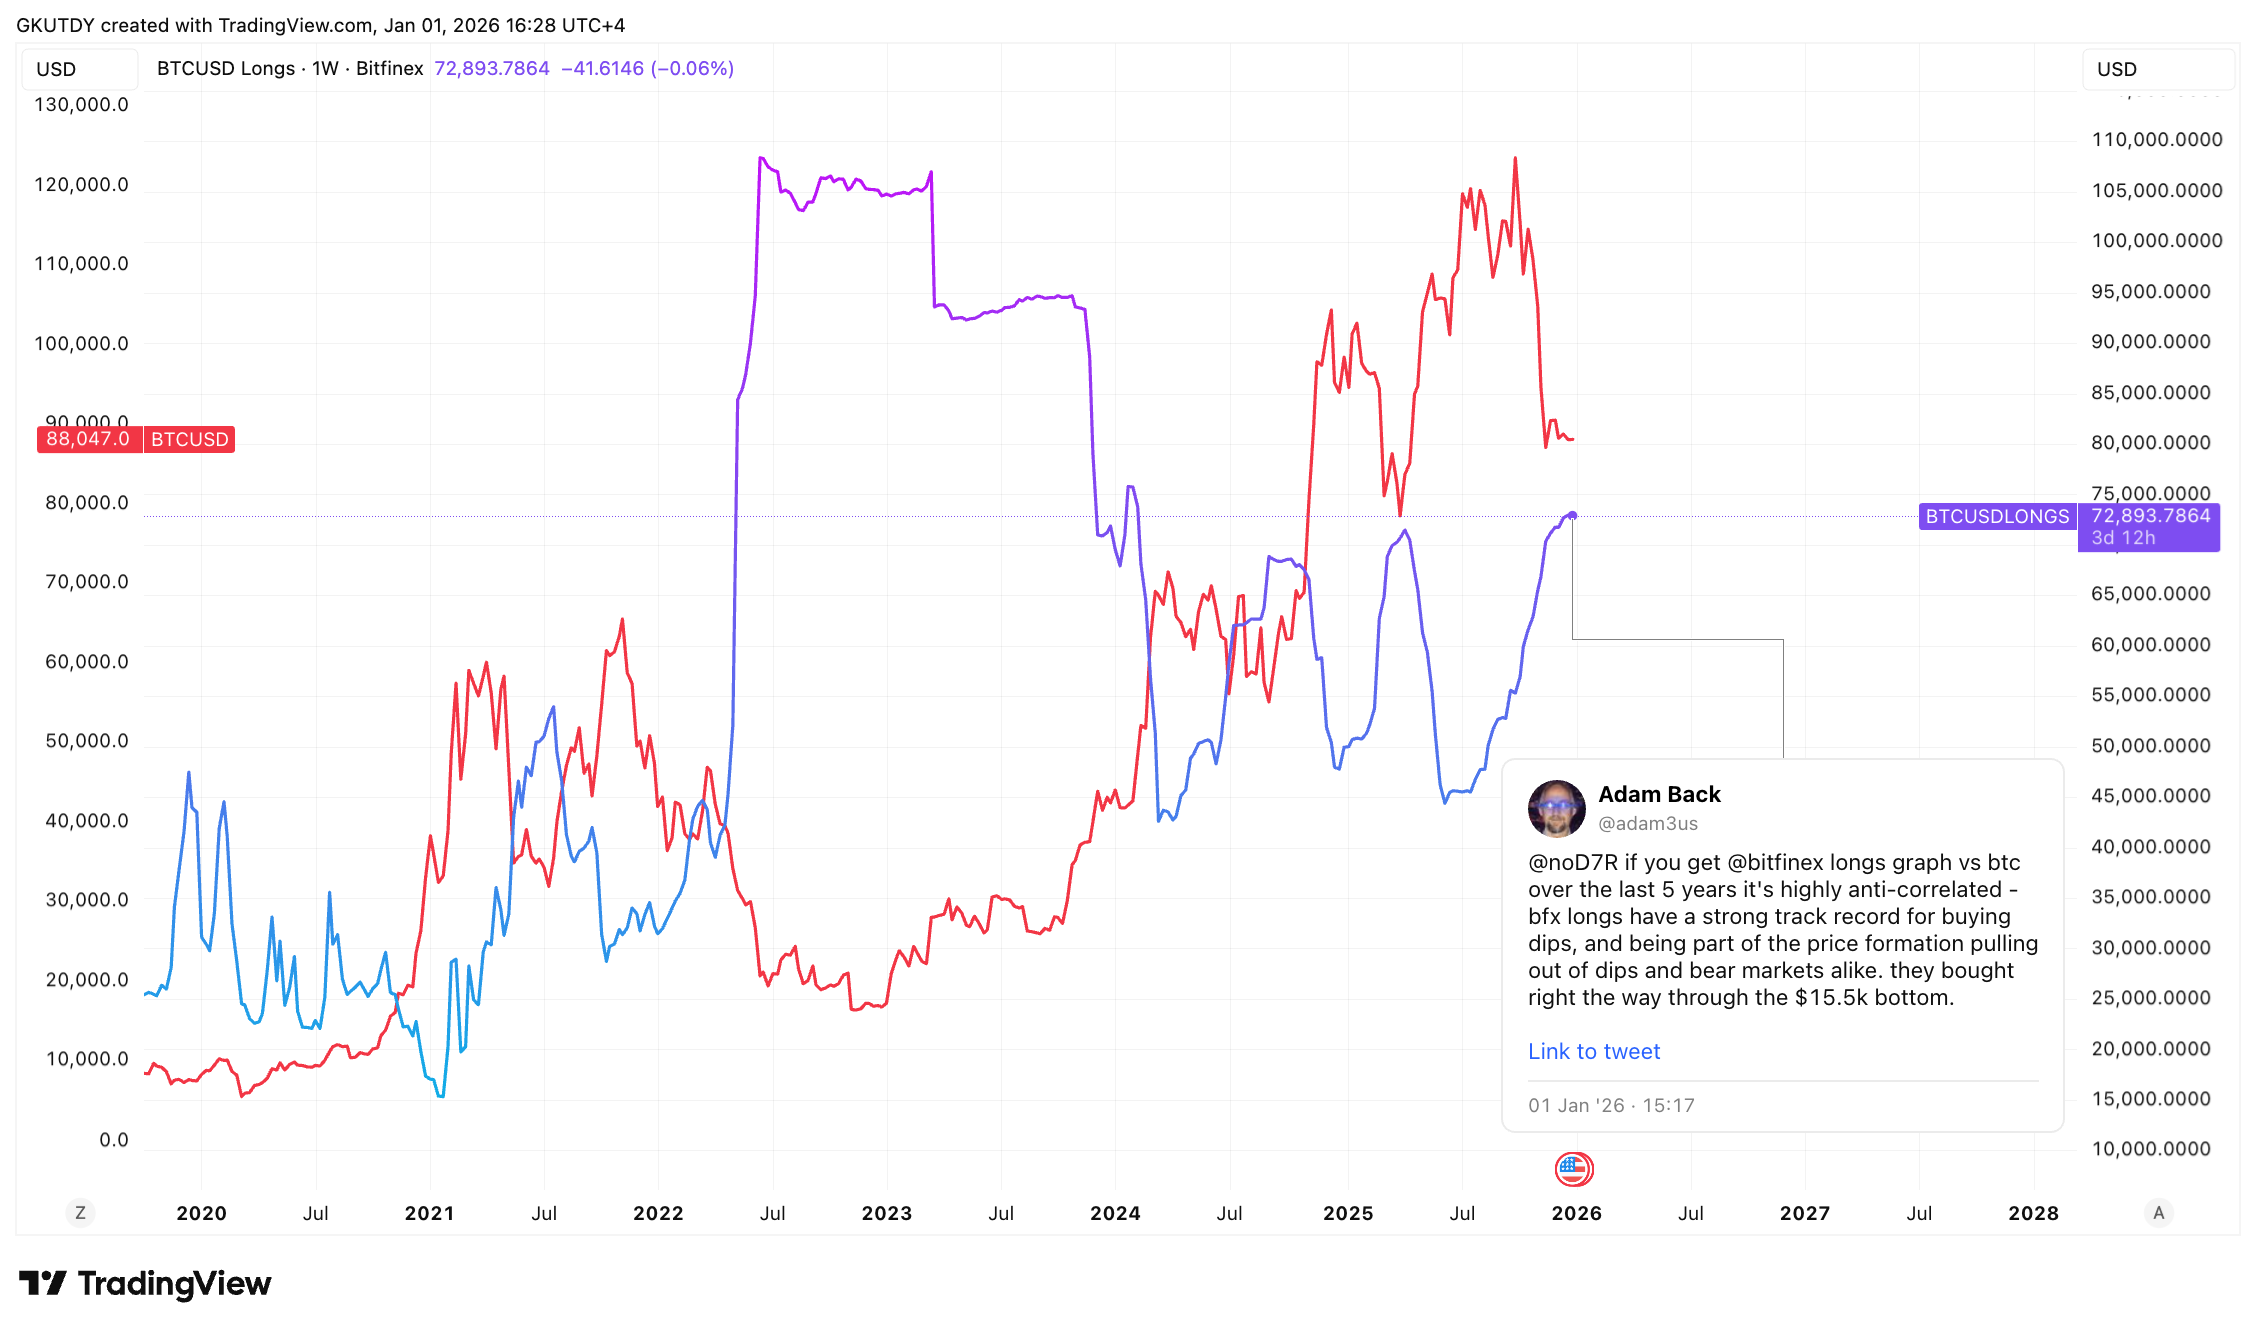
Adam Back, a man quoted in the Bitcoin white paper by Satoshi himself, recently drew attention to a cryptocurrency chart that he says too many people ignore: a TradingView overlay that plots Bitfinex BTCUSD longs against Bitcoin’s price. This chart shows how aggressively one pocket of the market adds exposure on down days, even when the price looks unstable.
Back frames the market with two lines: one "boring" line and one "ignored" line. The "boring" one is the 200-week moving average, which is currently near $57,000. The "ignored" line is the Bitfinex longs overlay, which is a demand indicator that remains effective even when the daily chart becomes noisy.
According to Back, Bitfinex margin longs expanded from 44,000 BTC to approximately 73,000 BTC over seven months. In other words, that is a consistent accumulation rate of nearly 1,000 BTC per week. Even during weaker sessions, the adds appear in the range of 300 to 450 BTC per day. This indicates a measurable flow of dip buying.
Converted into cash, the same behavior equates to a constant bid of about $4 million per day, or about $450 per second. This is why Back treats the chart as informative. It describes a market segment that does not require a new narrative to continue buying. Continuous demand can make a floor look like it is rising.
What's with Bitcoin right now?
As of now, the chart shows Bitcoin near $87,987 while the Bitfinex longs series reads about $72,891, but Back argues that the longer view is even more highly anti-correlated, pointing to the build through the $15,500 bottom.

Not to forget, the Bitfinex angle here is getting extra attention alongside fresh Tether numbers since the Tether CEO and Bitfinex CTO said Tether accumulated 8,888.8888888 BTC in Q4, 2025, including a 961 BTC withdrawal from Bitfinex.
 Dan Burgin
 U.Today Editorial Team