
Disclaimer: The opinions expressed by our writers are their own and do not represent the views of U.Today. The financial and market information provided on U.Today is intended for informational purposes only. U.Today is not liable for any financial losses incurred while trading cryptocurrencies. Conduct your own research by contacting financial experts before making any investment decisions. We believe that all content is accurate as of the date of publication, but certain offers mentioned may no longer be available.
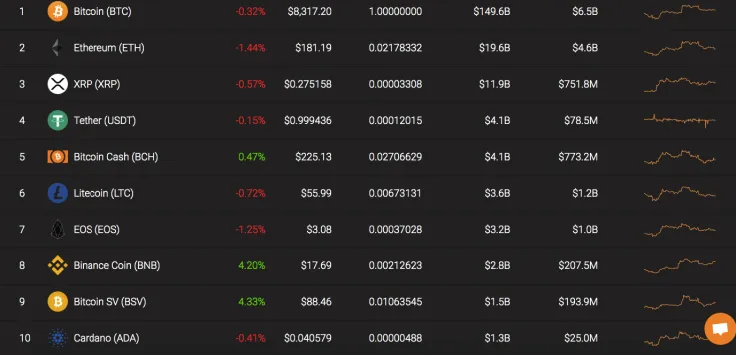
While other altcoins are showing a slight growth against the stagnated Bitcoin, the rate of Ethereum is going down. The price of the second most popular cryptocurrency has declined by 1.44% over the last 24 hours. The top gainer is Bitcoin SV whose rate has increased by 4.33% compared to its yesterday position.
These weekends Ethereum is trading almost in the same way as Bitcoin. However, traders are not sure about the future rise of ETH, as its rate keeps slightly going down.
Name: Ethereum
Ticker: ETH
Market Cap: $19 695 194 607
Price: $182,15
Volume (24h): $7 162 617 229
Change (24h): -1,44%
ETH/USD: Short-Term Forecast Remains Bearish
On the 1H chart, Ethereum has not got out form the bearish trend formed on October 11. Currently, there are no signals of the bulls’ pressure, as the price goes deeper after each bounce-off attempt.
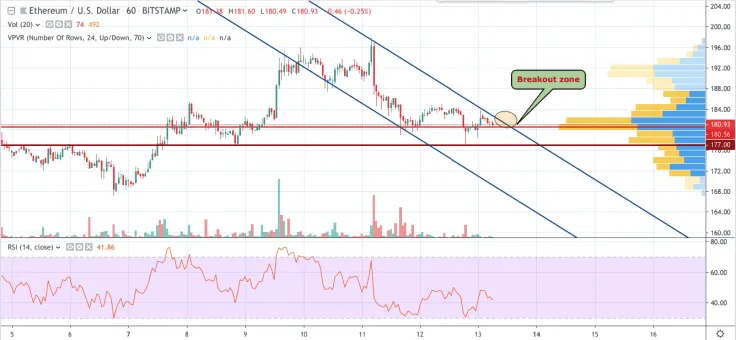
The low level of the trading volume confirms the bearish scenario as well as the decreasing RSI indicator which line is going down to the oversold area. In case ETH breaks the $180 level and fix above it, one may think about the local trend change. However, at the moment, the coin is likely to achieve the $177 mark in a few days.
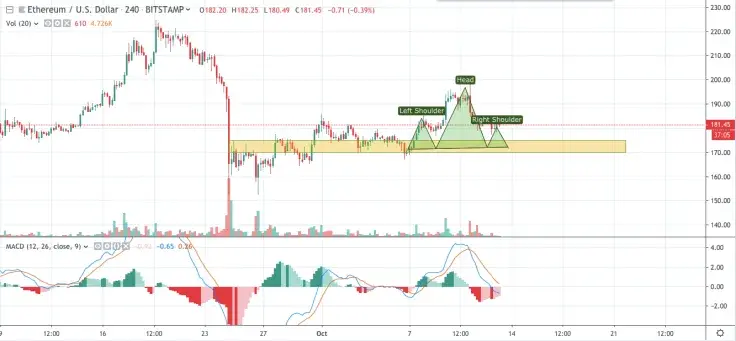
Our earlier Ethereum price prediction came true and the rate rolled back to the level around $180. On the 4H chart, Ethereum is also looking bearish. The lines of the MACD indicator are declining, suggesting that the current level is not the bottom.

Also, ETH is might be forming the Head and Shoulders pattern which confirms the scenario of an ongoing decline. Summing up, the rate is about to reach the yellow range between $170 and $175 until the last days of October.
Ethereum is trading at $181,45 at press time.
 Dan Burgin